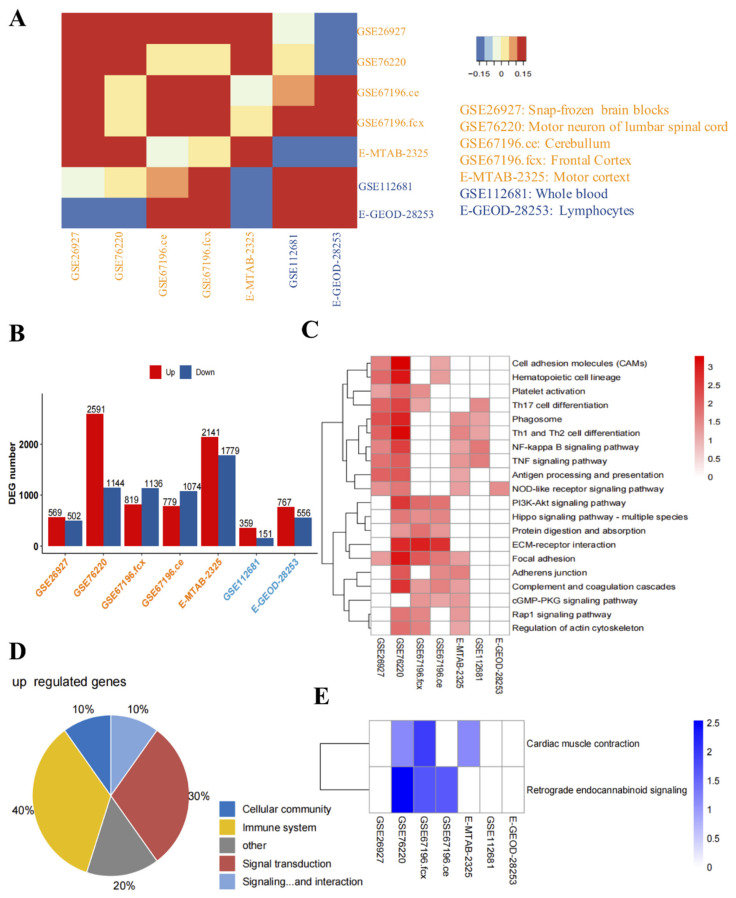
Figure 1.
Identification and functional analysis of the differentially expressed genes (DEGs) in the nerve tissue, lymphoid tissue, and whole blood of amyotrophic lateral sclerosis (ALS) patients. (A) Correlation analysis of the DEGs in the nerve tissue, lymphoid tissue, and whole blood of ALS patients. The color from blue to yellow to red represents the change of the correlation coefficient from negative to positive correlation. (B) Number of DEGs in the nerve tissue, lymphoid tissue, and whole blood of ALS patients. The horizontal axis represents the GEO number. (C) Enriched Kyoto Encyclopedia of Genes and Genomes (KEGG) pathways of the genes up-regulated in the nerve tissue, lymphoid tissue, and whole blood. The color from white to red represents the gradual change of p-value from high to low. If p < 0.05 is not satisfied, it is indicated in white. (D) Pie chart of the proportion of the genes up-regulated in various KEGG pathways in the nerve tissue, lymphoid tissue, and whole blood of ALS patients. (E) Enriched KEGG pathways of the genes down-regulated in the nerve tissue, lymphoid tissue, and whole blood. The color from white to blue represents the gradual change of p-value from high to low. If p < 0.05 is not satisfied, it is indicated in white.

