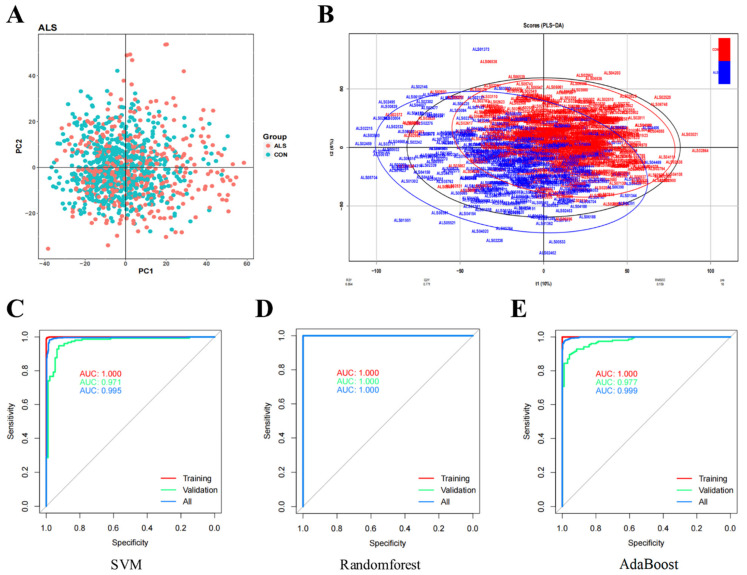
Figure 10.
Screening for prognostic markers in amyotrophic lateral sclerosis and model evaluation. (A) Principal component analysis. (B) Partial least squares discriminant analysis. (C–E) Receiver operating characteristic (ROC) curves of three classifiers. The three lines represent three datasets (Training, Validation, All), respectively. Area under the curve (AUC) value reflects the ability of the classifier to correctly sort the samples.

