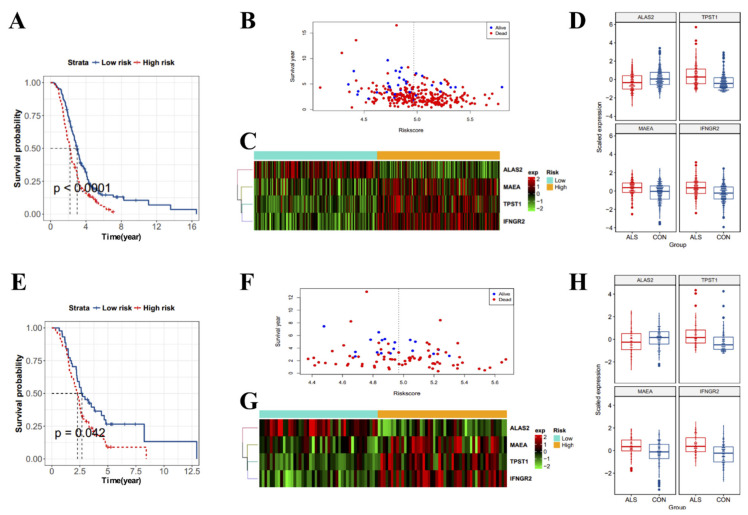
Figure 11.
Analysis of prognostic markers in amyotrophic lateral sclerosis (ALS) patients. (A) Survival curves of ALS patients in the training dataset. (B) Analysis of ALS patients with different survival statuses and survival periods in the training dataset according to risk score. Red indicates the dead ALS patients and blue indicates the surviving ALS patients. The vertical line indicates the median risk score; the left side of the median is low risk, and the right side is high risk. (C) Heatmap of the expression of four survival-related genes (MAEA, TPST1, IFNGR2, and ALAS2) in ALS patients in the training dataset. Different colors indicate gene expression levels in different samples. (D) Boxplots of the expression of four survival-related genes in ALS patients in the training dataset. (E) Survival curves of ALS patients in the validation dataset. (F) Analysis of ALS patients with different survival statuses and survival periods according to risk score. Red indicates the dead ALS patients and blue indicates the surviving ALS patients. The vertical line indicates the median risk score; the left side of the median is low risk, and the right side is high risk. (G) Heatmap of the expression of four survival-related genes in ALS patients in the validation dataset. Different colors indicate gene expression levels in different samples. (H) Boxplots of the expression of four survival-related genes in ALS patients in the validation dataset.

