Figure 1.
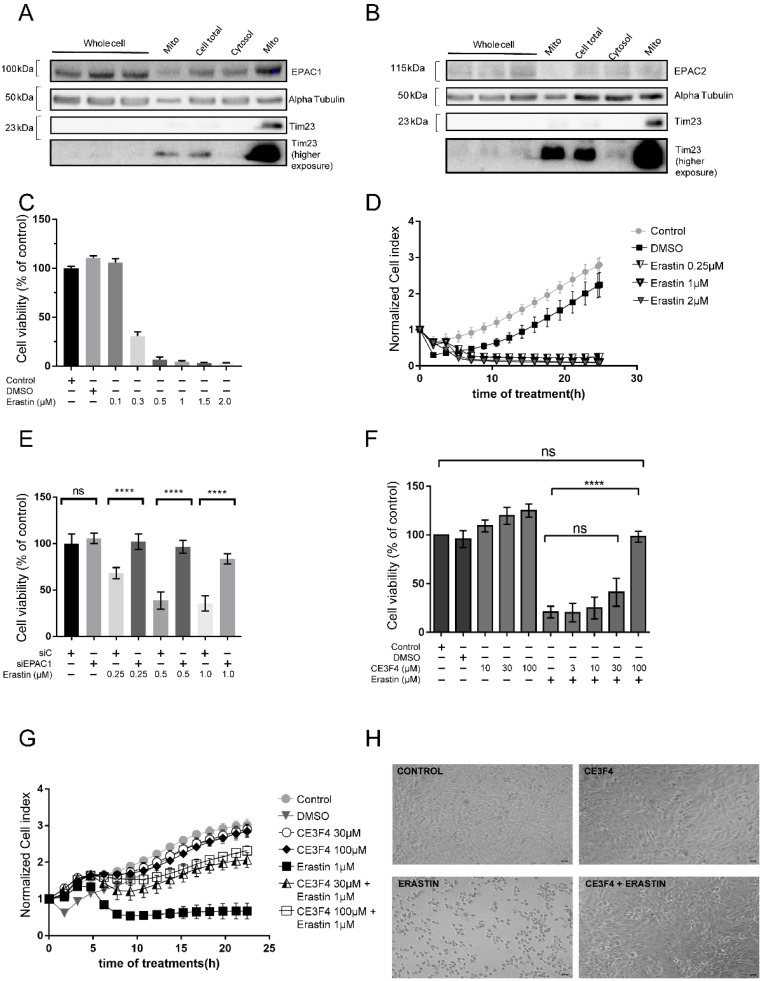
Epac1 silencing or pharmacological inhibition protects against erastin-induced ferroptosis. (A) Western Blot (WB) Epac1 expression. (B) WB Epac2 expression. Different fractions (cell total, cytosol and mito) are obtained via centrifugation steps. Mito is Mitochondria enriched fraction with first mito—20 μg and second mito—40 μg. Alpha Tubulin is the loading control. (C) Erastin dose response bar graph measured by MTT cell viability assay. Control is untreated cells. (D) Erastin kinetics curve measured by xCELLigence real-time impedance measurements. Control is untreated cells. (E) Dose-response curve of erastin on cell viability after silencing Epac1 as measured by the MTT assay. siC is control siRNA. (F) Dose-response curve of CE3F4, an Epac1 inhibitor on cell viability, as measured by the MTT assay. 30 min pre-treatment with CE3F4. (G) Real-time cell impedance measurements of HT-22 cells treated with erastin 1 μM and various concentrations of CE3F4 (30 μM and 100 μM). (H) Brightfield images of HT-22 cells treated with erastin 1 μM vs. control and CE3F4 100 μM + erastin 1 μM. Control is untreated cells or DMSO 1% as appropriate. Scale bars = 60 µm. n represents at least six technical replicates for each condition and greater than three biological replicates. One-Way ANOVA statistical analysis with Bonferroni correction was used. ns p > 0.05, **** p < 0.0001.

