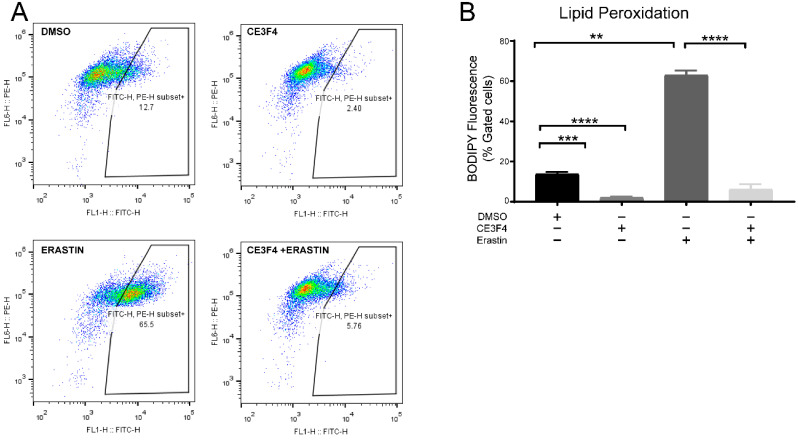
Figure 7.
Epac1 inhibition attenuates lipid peroxidation. (A) Representative graphs of lipid peroxidation under 1 µM erastin-induced ferroptosis and Epac1 inhibition using either 100 μM CE3F4. (B) Representative graph of lipid peroxidation under 1 µM erastin-induced ferroptosis and Epac1 inhibition using either 100 μM CE3F4. Control is DMSO 1%. n = 3 biological replicates. One-Way ANOVA statistical analysis with Bonferroni correction was used. ns p > 0.05, ** p < 0.01, *** p < 0.001, **** p < 0.0001.

