Figure 1.
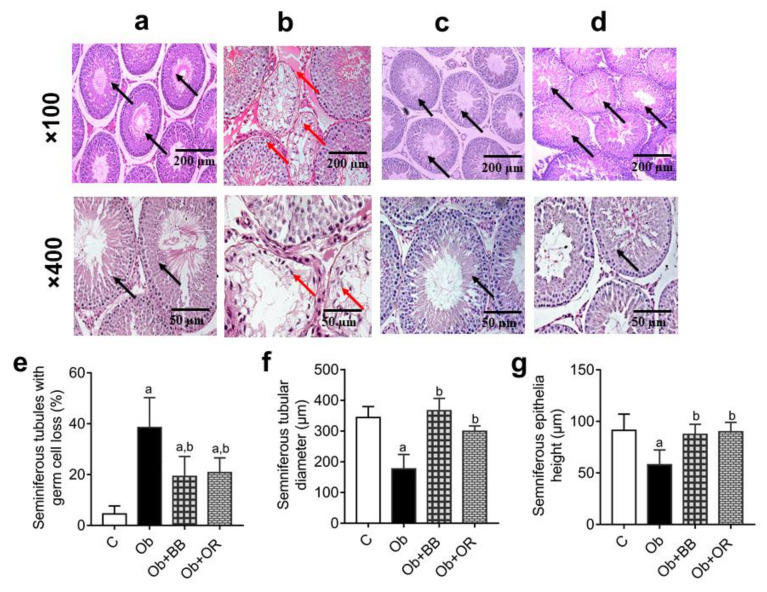
Representative photomicrographs of H&E staining of testes in (a) C, (b) Ob, (c), Ob + BB (d) Ob + OR groups. C: control; Ob: obese rats; Ob + BB: obese + bee bread (6 weeks after induction of obesity); and Ob + OR: obese + orlistat (6 weeks after induction of obesity). The seminiferous tubules in the Ob group were collapsed showing decreased amount of sperm and germ cells (red arrows) compared to C, Ob + BB and Ob + OR groups (c,d) which showed increased amount of sperm and germ cells as well as normal size seminiferous tubules (black arrows) (magnification of panel above: ×100, scale bar = 200 µm; magnification of panel below: ×400, scale bar = 50 µm). (e) Seminiferous tubule with germ cell loss, (f) seminiferous tubular diameter, and (g) seminiferous epithelial height are quantitative data, values are mean ± SD, n = 6. a p < 0.05 vs. C, b p < 0.05 vs. Ob (one-way ANOVA followed by Tukey post-hoc test).

