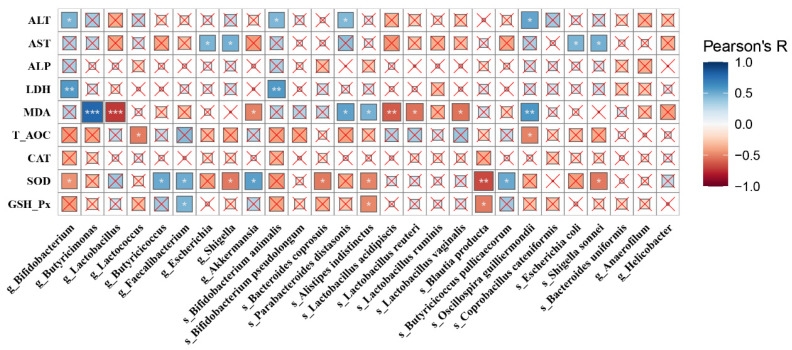
Figure 7.
A heatmap of Pearson’s correlation. Correlation between the gut microbes and biochemical parameters (ALT, AST, ALP, LDH, MDA, T-AOC, CAT, SOD and GSH-Px). The sizes of boxes reflect the correlation coefficient. The depth of colors was according to the Pearson’s correlation coefficient distribution. × p > 0.05, * p < 0.05, ** p < 0.01, *** p < 0.001.

