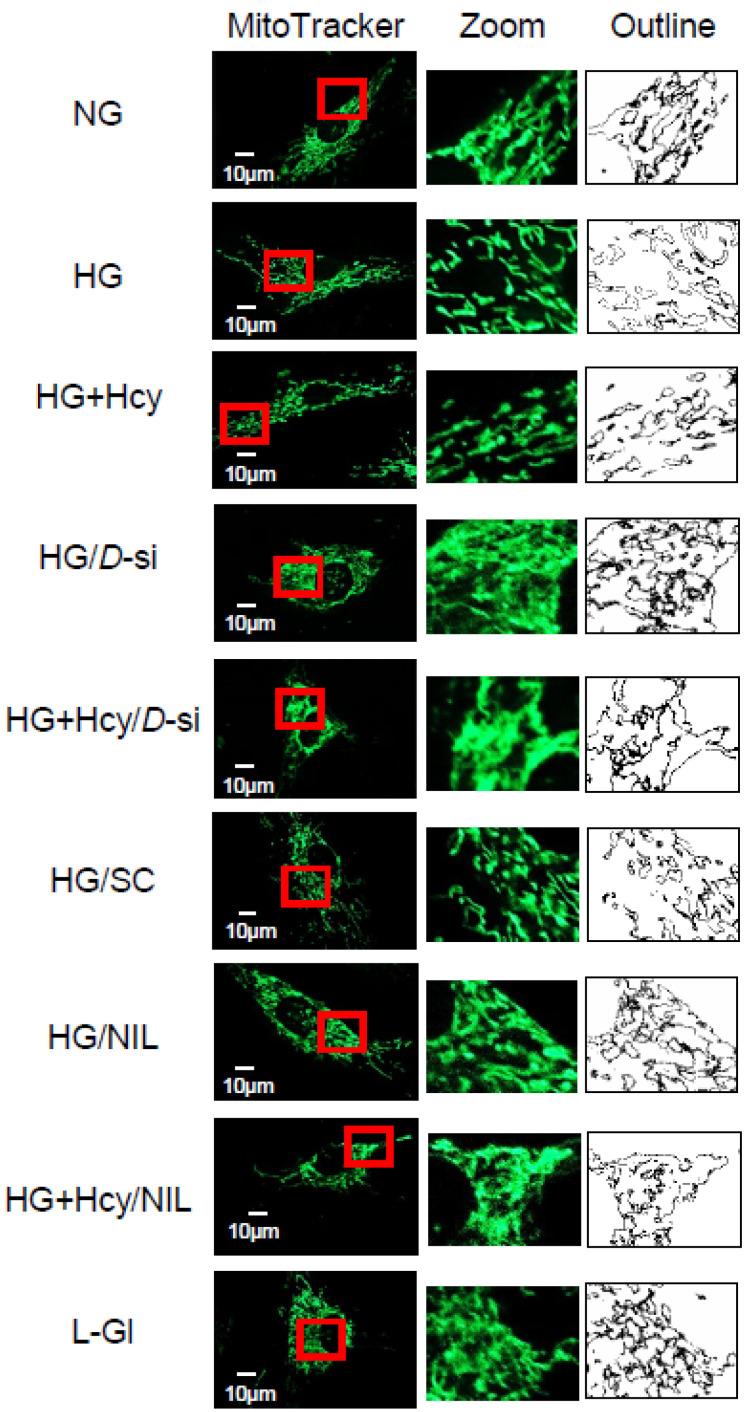
Figure 2.
Effect of homocysteine on glucose-induced mitochondrial fission. Live-cell microscopy was performed on HRECs plated on coverslips using 200 nM MitoTracker green dye. The coverslips were imaged under a ZEISS Apotome microscope using a 40× objective. Enlarged area inside the box is shown in the middle panel, and the bare outlines, drawn to illustrate the morphology, are in the right panel. The image is representative of 3–4 different experiments, with each experiment performed in 6–8 cells: NG and HG, cells in normal and high glucose, respectively; HG + Hcy, cells in high glucose and homocysteine; HG/D-si and HG + Hcy/D-si, Drp1-siRNA transfected cells in high glucose or high glucose + homocysteine, respectively; HG/SC, nontargeting scrambled RNA transfected cells in high glucose; HG/NIL and HG + Hcy/NIL, cells in the presence of NIL in high glucose or high glucose + homocysteine, respectively; L-Gl, 20 mM L-glucose.

