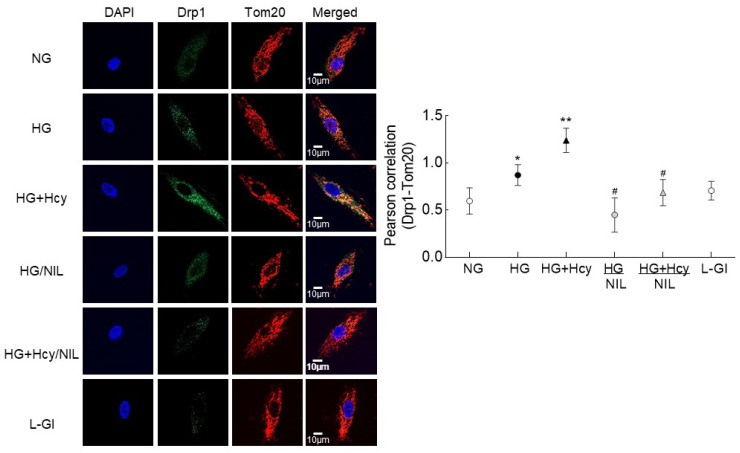
Figure 4.
Mitochondrial translocation of Drp1. Mitochondrial localization was determined by immunofluorescence technique using Alexa Fluor–488 (green) conjugated secondary antibody for Drp1 and Texas red conjugated for the mitochondrial marker Tom20. DAPI-containing (blue) Vectashield mounting medium was used for mounting the cells, and the cells were imaged using a 63× oil objective lens on a ZEISS microscope. Pearson’s correlation coefficient between Drp1 and Tom20 was calculated using the colocalization ZEISS software module. The values in the graphs are presented as mean ± SD obtained from 3–4 different cell preparations. NG, cells in normal glucose; HG and HG + Hcy, cells in high glucose and high glucose + homocysteine respectively; HG/NIL and HG + Hcy/NIL, cells in high glucose containing NIL in the presence or absence of homocysteine, respectively; L-Gl, 20 mM L-glucose; * p < 0.05 compared to NG; ** p < 0.05 compared to HG; # p > 0.05 compared to NG.

