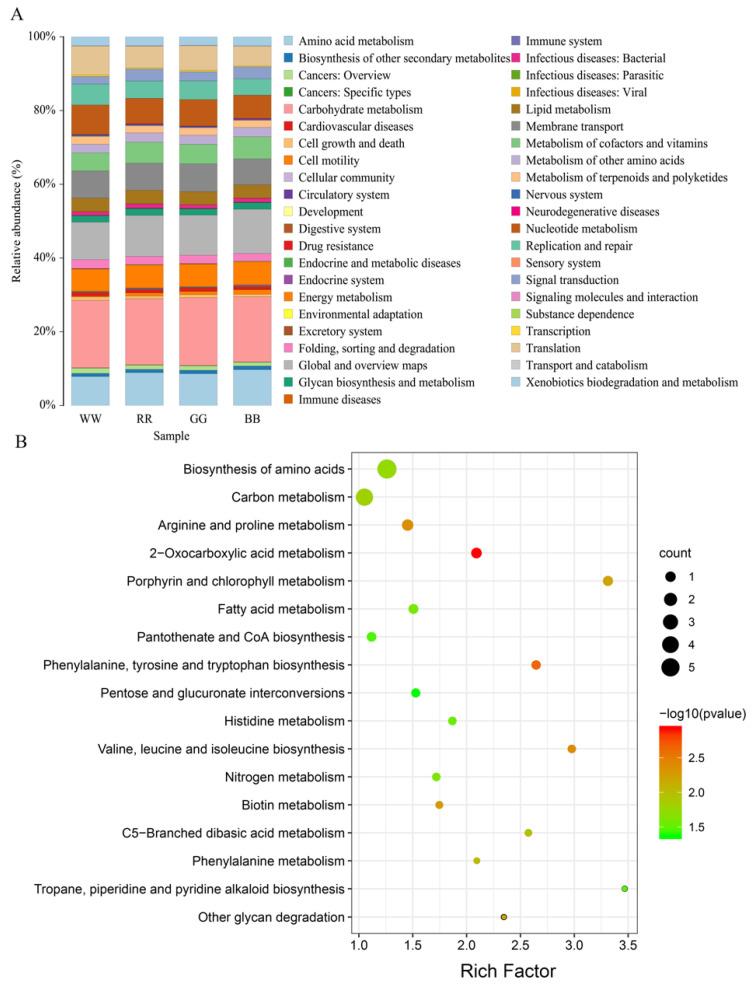
Figure 3.
KEGG difference analysis of WL, RL, GL and BL (A). Scatter plot of enriched KEGG pathways statistics among WL and BL (B). On the KEGG enrichment scatter plot, the 17 most significant enriched pathways in WL and BL are presented. The y-axis represents the name of the pathway and the x-axis represents the rich factor. The rich factor is the ratio of the differentially expressed gene number in BL to WL in a certain pathway. The count size stands for the number of different genes and the color stands for different p-values. WL: white light; RL: red light; GL: green light; BL: blue light.

