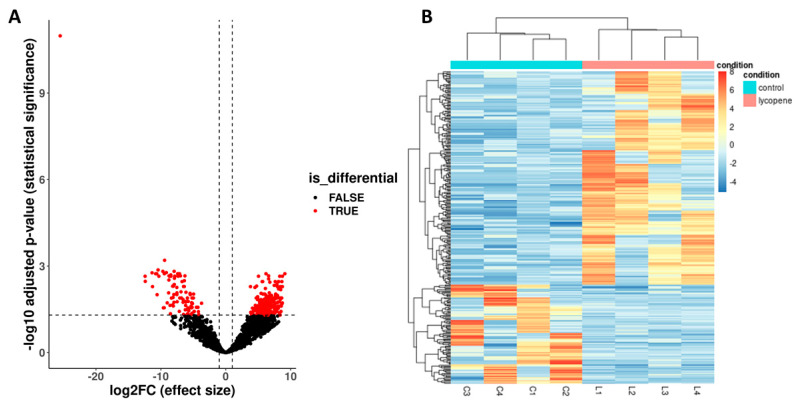
Figure 5.
Differentially expressed (DE) genes between lycopene-treated (0.2 μM final concentration) and non-treated (control) day 8 blastocysts. Lycopene treatment was performed during in vitro oocyte maturation. RNA-sequencing was performed from eight pools (four lycopene and four control) of ten blastocysts per pool. (A) Volcano plot showing DE genes (p < 0.05 and ≥ 1-log2-fold change) between lycopene and control embryos. Two hundred and two genes were upregulated and 94 were downregulated in lycopene versus control. (B) Heatmap of the median ratio method of differentially expressed genes. The expression pattern is indicated by a gradient of color from red (upregulation) to blue (downregulation) in lycopene versus control. Branches in the horizontal dendrogram expose perfect clustering in lycopene-treated and control embryos.

