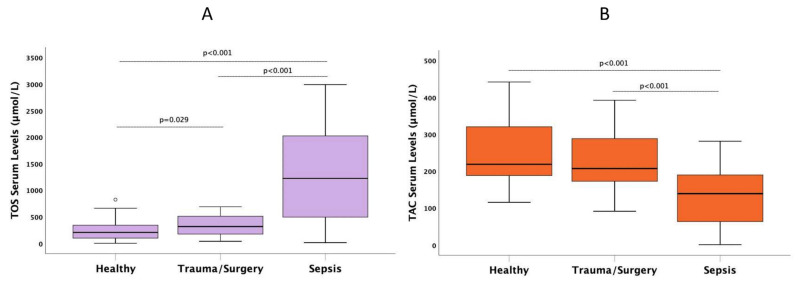
Figure 1.
Serum median levels of (A) total oxidative stress (TOS) and (B) total antioxidant capacity (TAC) in septic patients in comparison to patients with non-infectious (trauma/surgery) and healthy controls. The bold black line in box plots indicates the median per group, the bottom of the box indicates the 25th percentile, and the top of the box represents the 75th percentile; the T-bars (whiskers) and horizontal lines show minimum and maximum values of the calculated non-outlier values. Connectors indicate significantly higher levels in sepsis (post hoc Dunn’s pairwise tests with Bonferroni corrections).

