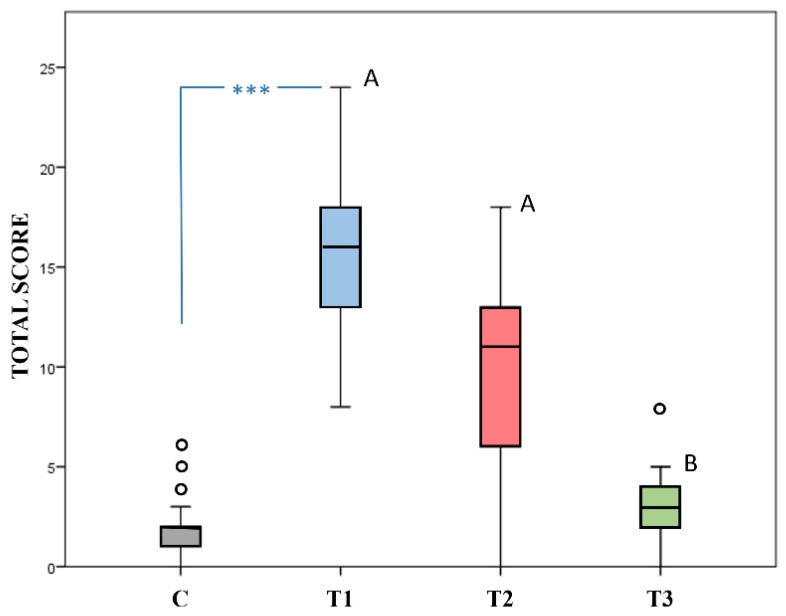
Figure 2.
FCPS Total scores recorded in 35 healthy pain-free foals (Control Group = C) and in 15 sick foals experiencing pain at three different time points (T1: at inclusion in the study; T2: after anti-inflammatory drugs; T3: at recovery). The presence of *** indicates a significant difference between groups at inclusion (C vs. T1, Mann Whitney U test p < 0.001). Different superscript letters (A, B) indicate a significant difference (p < 0.001) between time points (Tukey’s test, T3 vs. T2, T1). Outliers are shown as dots °.

