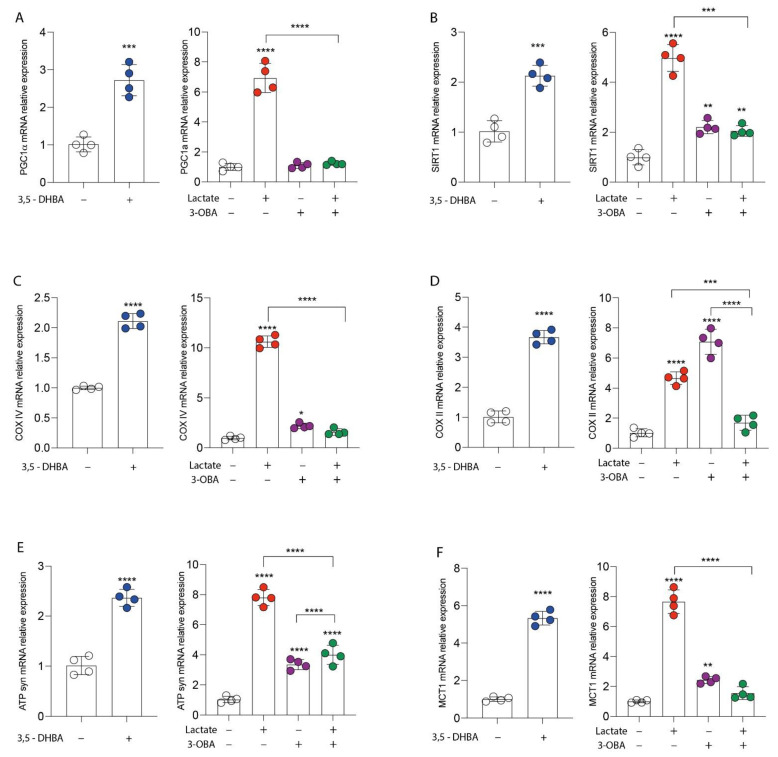
Figure 2.
GPR81 modulates mitochondrial metabolism gene expression. Evaluation of relative mRNA expression levels of (A) PGC1alpha, (B) SIRT1, (C) COX IV, (D) COX II, (E) ATPsyn, (F) MCT1, following 24 h of lactate (20 mM), 3,5-DHBA (150 μM) and 3-OBA (3 mM) exposition, analyzed by real-time PCR. The calculated value of 2−ΔΔCt in untreated controls is 1. Data are expressed as mean ± SD of at least four independent experiments. * p < 0.05; ** p < 0.005; *** p < 0.001; **** p < 0.0001.

