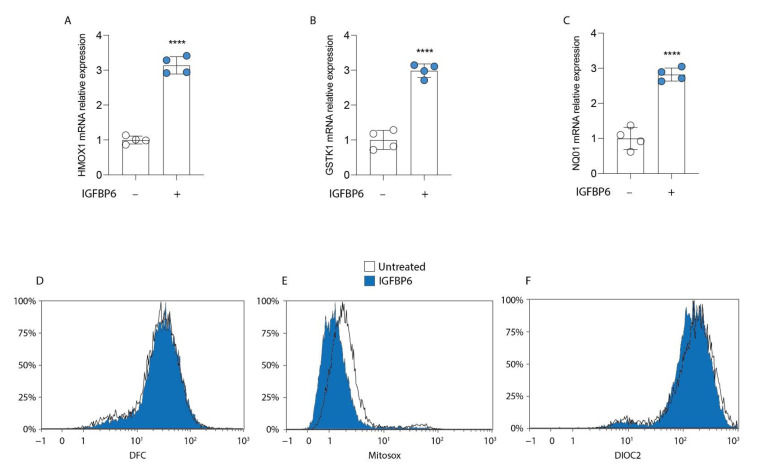
Figure 5.
IGFBP6 induces an antioxidant response in MDA-MB-231 cells. Evaluation of relative mRNA expression levels of HMOX1 (A), GSTK1 (B) and NQ01 (C), following 24 h of IGFBP6 (800 ng/mL) treatment. The calculated value of 2−ΔΔCt in untreated controls is 1. Data are expressed as mean ± SD of at least four independent experiments. **** p < 0.0001. Representative plots of ROS (D) and mitochondrial ROS (E) production using DCF and MitoSox probe, following 24 h of IGFBP6 exposure. Representative plot of mitochondrial membrane potential (F) evaluated with DiOC2 staining, following 24 h of IGFBP6 treatment. Plots are representative of at least four independent experiments.

