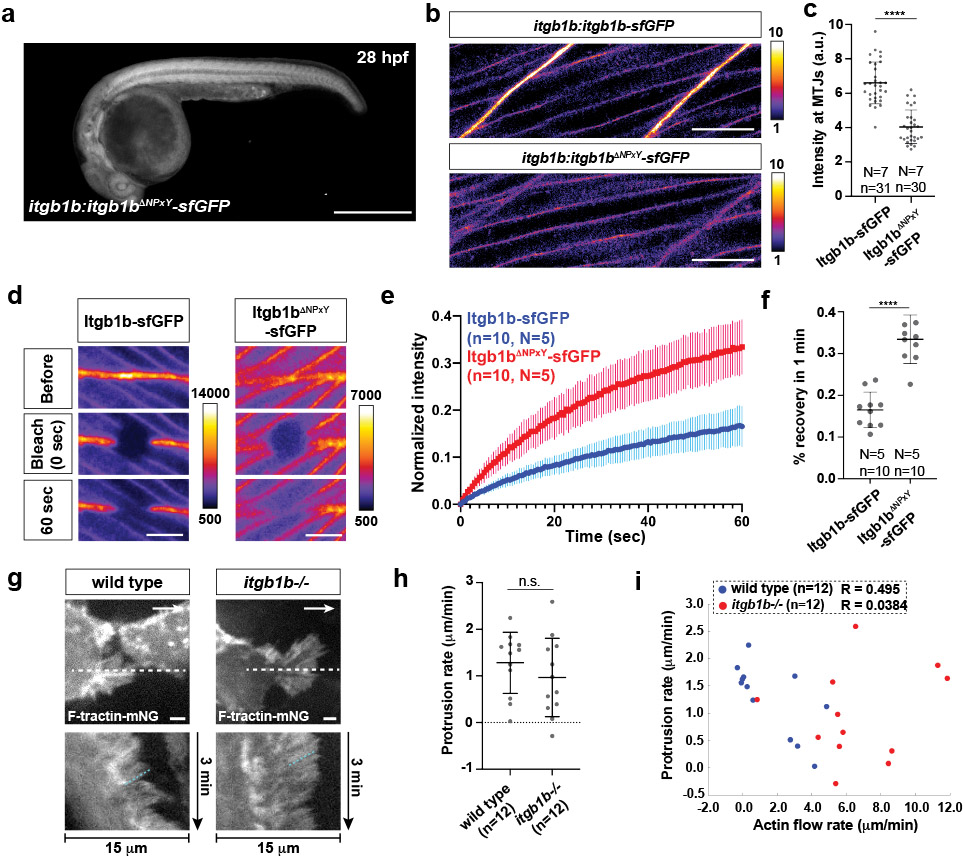
Extended Data Fig. 7. Generation and characterization of itgb1b:Itgb1bΔNPxY-sfGFP mutant knock-in line and F-actin retrograde flow analysis.

a, Itgb1bΔNPxY-sfGFP expression in a 28 hpf itgb1bΔNPxY-sfGFP embryo. Image is sum-projected z-stacks. Scale bars = 0.5 mm. b, Distribution of Itgb1b-sfGFP and Itgb1bΔNPxY-sfGFP in muscle of 33 hpf embryos. Images are single z-slices through muscle at the myotendinous junction imaged and scaled identically. The GFP intensity is pseudo-colored as a heat map. Scale bars = 20 μm. c, Quantification of the Itgb1b-sfGFP and Itgb1bΔNPxY-sfGFP fluorescence intensities at the myotendinous junction (MTJ). Data points, means, and SD are indicated. ****: p<0.0001 (two-tailed Mann-Whitney test). n = number of experiments (used for statistical analysis), N = number of embryos. d, Images from time-lapse video after photo-bleaching of Itgb1b-sfGFP and Itgb1bΔNPxY-sfGFP at the myotendinous junction. GFP intensities are pseudo-colored as heat maps. Scale bars = 10 μm. e, Graph of Itgb1b-sfGFP and Itgb1bΔNPxY-sfGFP fluorescence intensities over time before and after photo-bleaching. The GFP fluorescence intensities are normalized to the minimal intensities after photo-bleaching. Dots indicate mean intensities and error bars are SD. n = number of experiments, N = number of embryos. f, Plot of the percent recovery of Itgb1b-sfGFP and Itgb1bΔNPxY-sfGFP fluorescence intensities at 1 min after photo-bleaching shown in e. n = number of experiments (used for statistical analysis), N = number of embryos. Data points, means, and SD are indicated. ****: p<0.0001 (two-tailed t-test). g, Images of F-tractin-mNeonGreen localization at the apical sides of wild-type and itgb1b−/− primordium superficial cells (top). White arrows indicate the direction of migration. Scale bar = 2 μm. Images are single optical sections from Video 6. Kymographs of Video 6 along the dotted line indicated in top images (bottom). The dotted cyan line indicates the rate of actin flow. h, Protrusion rates in wild-type and itgb1b mutant primordium basal cells. Data points, means, and SD are indicated. n.s.: p=0.3167 (two-tailed t-test). n = number of cells. i, Plot of the protrusion rate versus the actin flow rate in individual primordium basal cells. n = number of cells.
