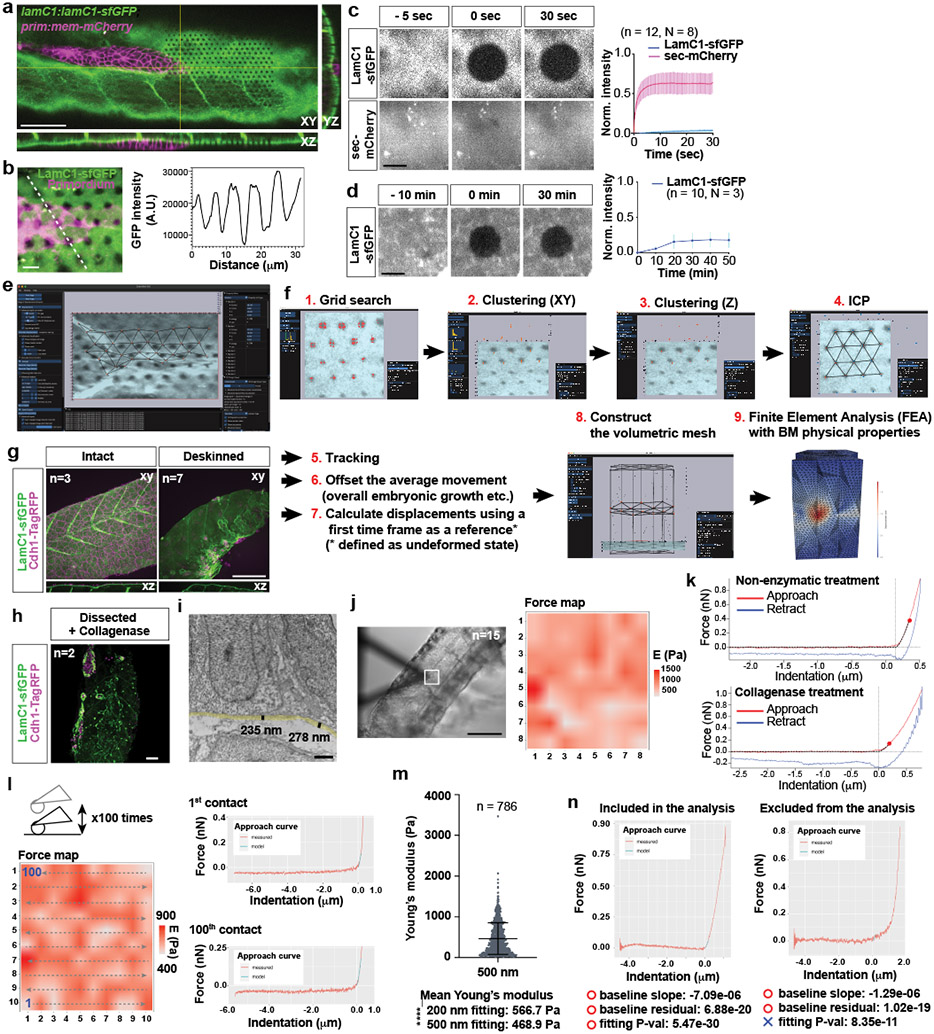
Extended Data Fig. 8. LamC1-sfGFP mobility, Embryogram workflow, and basement membrane stiffness measurements.

a, Optical sections along the indicated planes of a z-stack of the primordium and the BM labeled with LamC1-sfGFP from Video 7. LamC1-sfGFP was bleached in front of the primordium in a hexagonal pattern. Scale bar = 50 μm. b, Hexagonal bleach pattern on LamC1-sfGFP-labeled BM underneath the migrating primordium (left). Dotted line indicates location of intensity profile shown on right. Scale bar = 5 μm. The image is a maximum-projected z-stack. c, FRAP analysis of LamC1-sfGFP and extracellular mCherry in heat-shocked hsp70l:sec-mCherry; lamC1:lamC1-sfGFP embryos. Images from the time course are shown on the left and quantification of fluorescence recovery is shown on the right. Scale bar = 10 μm, error bars = SD, n = measurements from N embryos, dots = means, n was used for statistical analysis. d, Extended FRAP analysis of LamC1-sfGFP over 50 min in lamC1:lamC1-sfGFP embryos. Images from time course are shown on the left and quantification of fluorescence recovery is shown on the right. Scale bar = 10 μm, error bars = SD, dots = means, n = measurements from N embryos. n was used for statistical analysis. e, Image of Embryogram application user interface. f, In Embryogram, candidate locations for the bleached markers are identified by a grid search (1), clustered in the XY-plane (2), and then along the Z-axis (3). We match these candidates with a regular hexagonal grid using the iterative closest point algorithm (4). Markers are tracked in subsequent frames using optical flow and numerical optimization. The user can manually offset rigid body motions caused by the movement of the microscope, sample movement or sample growth (6). The displacement of each dot is calculated using the mesh for the first time frame as the relaxed reference (7). To perform finite element analysis (FEA), the user constructs a volumetric tetrahedral mesh above, below or both (8) and inputs the Young’s modulus and the Poisson ratio of the material. The results of the FEA can be exported and visualized in other software packages such as ParaView (9). For detail see Supplementary Note 1. g, 28 hpf embryos with labeled skin and BM before and after surgical skin removal. Images are maximum-projected z-stacks. Scale bar = 100 μm. h, Deskinned and collagenase-treated lamC1:lamC1-sfGFP; cdh1:cdh1-TagRFP embryo. Image is a maximum-projected z-stack. Scale bar = 50 μm. i, TEM-image of the BM underneath the primordium. The semi-transparent yellow line traces the BM and the black lines indicate the thickness of the BM. Scale bar = 1 μm. j, Bright-field image of a deskinned embryo tail with the cantilever during an AFM measurement (left). A grid of 8×8 squares (20 μm by × 20 μm) on the BM was probed for its stiffness (square in left image) and the resultant stiffness map is shown on the right. Scale bar = 1 mm. k, Representative force curves showing the approach (red) and retraction (blue) curves for a deskinned embryo (top) and a collagenase-treated deskinned embryo (bottom). Cross-hairs indicate contact point position and force. Red dots on the approach curves indicate the first 200 nm from the contact point. The fit to the baseline and the Hertz model is indicated by a dotted black line. l, Analysis of the effect of repeated probing of the same area by AFM. The left image is a montage of the stiffness values obtained for the same location after measurements 1 to 100. The order of the measurements is indicated by the arrows. The force curves for the first and 100th measurements are shown on the right. The fit to the Hertz model is indicated in cyan. m, Quantification of the stiffness of the BM of deskinned embryos when fitting the first 500 nm after the contract point to the Hertz model. Data points, mean and SD are shown. Values for the fit of the first 200 nm to the Hertz model are shown for comparison. ****: p<0.0001 (two-tailed Mann-Whitney test). n, Representative force curves that meet (left) and do not meet (right) the indicated quality criteria.
