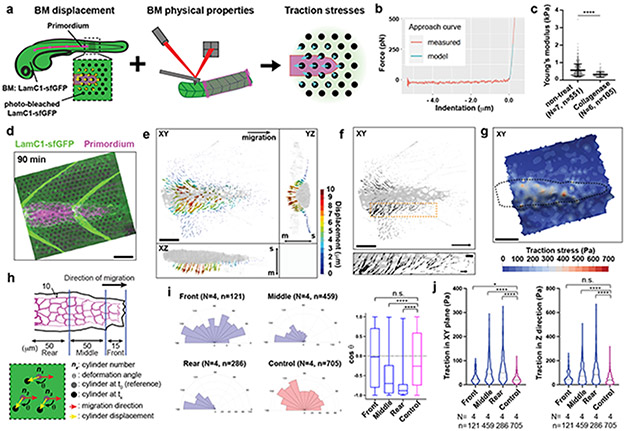
Fig. 6. Traction stress measurements indicate that the primordium exerts highest stresses in its rear.
a, Strategy to measure traction stresses in vivo. b, Representative force curve of BM stiffness measurement by AFM. Fit of the first 200 nm after the contact point at 0 μm to the Hertz model is indicated in cyan. Only the approach part of the force curve is shown. c, Quantification of the BM stiffness with and without Collagenase treatment. N = number of embryos, n = number of recorded approach curves. Individual data points, means, and SD are indicated ****: p<0.0001 (two-tailed Mann-Whitney test). d, Maximum-projected z-stack (Video 8). Scale bar = 25 μm. e, BM displacement by the primordium (grey) shown as a vector field along the X-, Y- and Z-axes (Video 10). The displacement vector magnitude is indicated as a color map. XY-view is shown from the basal side of the primordium. s: skin, m: muscle. Scale bar = 25 μm. f, BM displacement in the XY-plane by the primordium (grey) shown as a vector field (Video 10). Displacement field in the XY-plane is shown from the basal side of the primordium. Scale bar = 25 μm. Bottom panel is a magnification of the outlined region in top panel. Scale bars = 25 μm (top) and 5 μm (bottom), arrow = 50 μm (top) and 10 μm (bottom). g, Traction stress magnitudes on the BM indicated as color map (Video 10). Scale bar = 25 μm. h, Schematic of the approach to quantify the traction stresses and BM displacement vector direction. i, BM displacement vector angles with respect to the migration direction (0°). Mean, 25th–75th percentiles (box), and min/max (whiskers) are indicated N = number of embryos, n = number of bleached cylinders. ****: p<0.0001 and n.s.: p=0.6291. j, Pooled traction stresses exerted by the primordium on the BM. Magnitude in XY-plane (left) and along the Z-axis (right) with median (dashed line) and quartile (dotted line) are shown. *: p=0.0302, ****: p<0.0001, n.s.: p=0.2273 (two-tailed Mann-Whitney test). N = number of embryos, n = number of bleached cylinders analyzed. For c, i, j, n was used for statistical tests.

