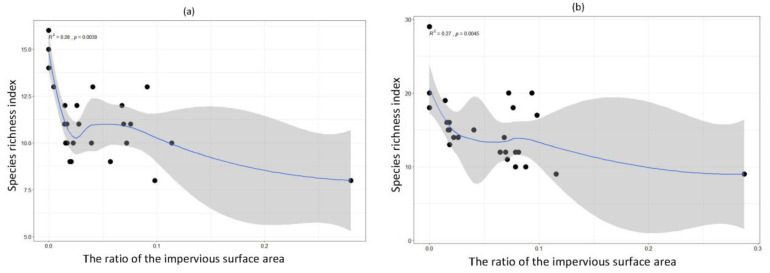
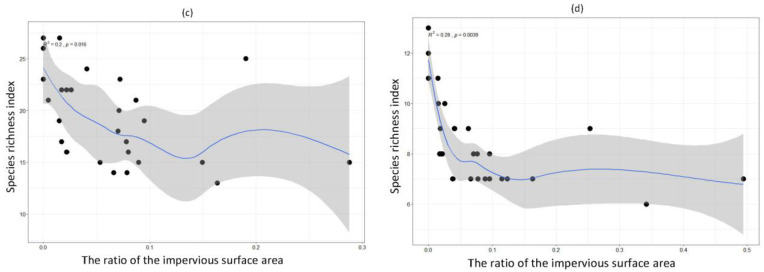
Figure 4.
Non-linear regression between species richness index of waterbirds and urbanisation intensity. All data are log-transformed [≥(x + 1)]. The grey area indicates the confidential intervals for the fitted lines. (a) Summer; (b) Autumn; (c) Winter; (d) Spring. The dots in the figure represent the various river sections of the different rivers.


