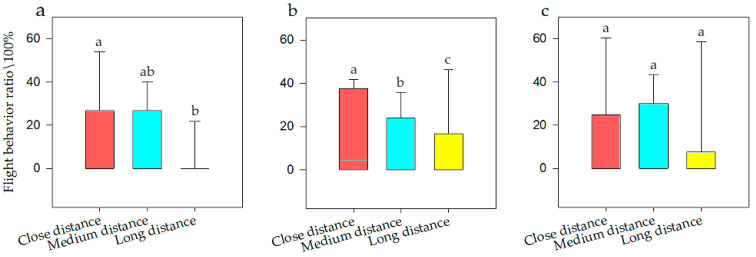
Figure 6.
Flight behavior of bean geese ((a) Population N; (b) Population N1; (c) Population N2) of close distance, medium distance, and long distance. Different letters in the graphs represent significant differences from one-way ANOVA and SNK tests. Bars represent means; error bars denote standard deviations. The bar with the highest flight behavior ratio is marked as “a”. The flight behavior ratio is compared with other interference distances, and the difference is significant, marked as “b”.

