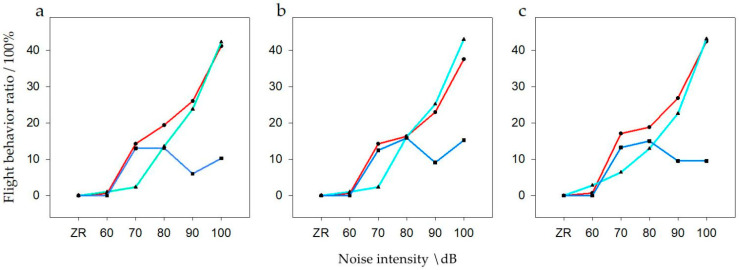
Figure 7.
Flight behavior of bean geese ((a) Population N; (b) Population N1; (c) Population N2) of different noise intensity (ZR (background noise), 60, 70, 80, 90, and 100 dB) and interference distances. The red line of black points in the graphs represent close distances; the light blue line of triangular points in the graphs represent medium distances; the blue line of square points in the graphs represent long distances.

