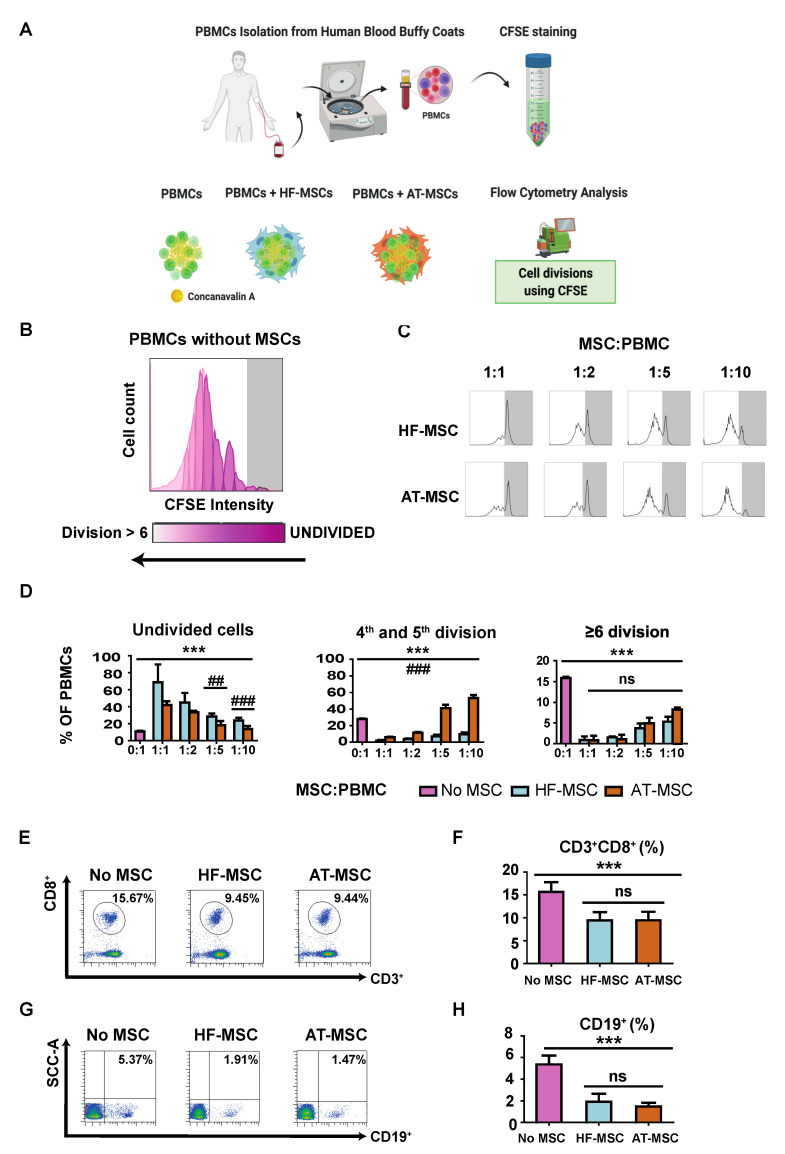
Figure 5.
Immunosuppressive effect of MSCs in concanavalin-A stimulated PBMCs. (A) PBMCs were isolated from the blood of human healthy donors and stained with CFSE to monitor their proliferation. (B,C) Flow cytometry histograms of the proliferation profile of PBMCs alone or co-cultured with MSCs. (D) Percentages of PBMCs remaining undivided, undergoing four and five divisions, and undergoing more than or six divisions. (E,G) Flow cytometry dot plots depicting the populations of CD3+CD8+ T cells (E) and CD19 cells (G) and their percentages (F,H) when PBMCs were cultured alone or with MSCs. Each datapoint represents the mean for at least three wells ± SD. Statistical significance: *** p < 0.001, ns, no significant difference p > 0.05 when compared with PBMCs without MSCs; ### p < 0.001 and ## p < 0.01 when comparing HF-MSCs with AT-MSCs. ns: not significant differences, p > 0.05. PBMCs, peripheral blood mononuclear cells. HF-MSCs, hair follicle-derived MSCs. AT-MSCs, adipose tissue-derived MSCs.

