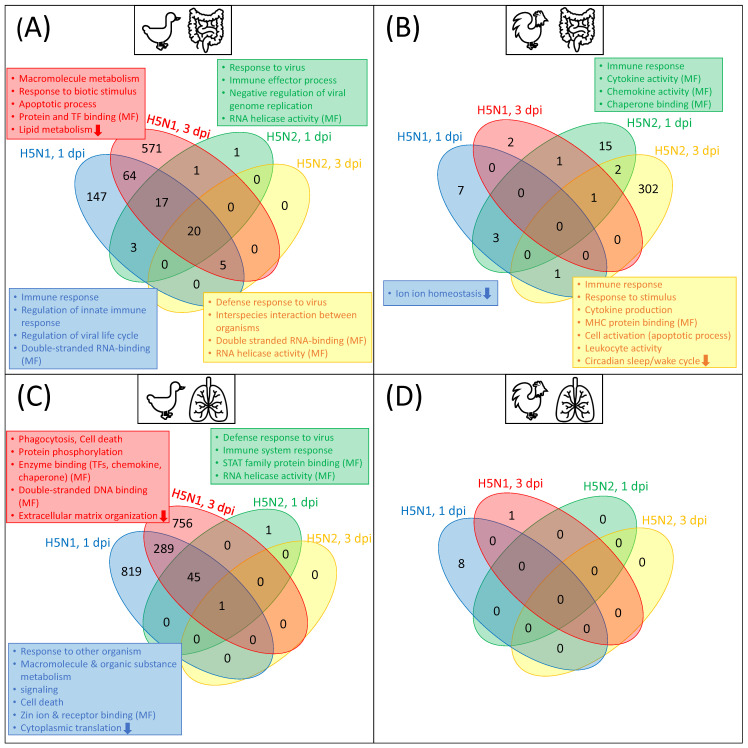
Figure 2.
Venn diagrams of the DEGs (A) duck in ileum, (B) chicken in ileum, (C) duck in lung, and (D) chicken in lung with selected enriched Gene Ontology (GO) terms. The DEGs are obtained by comparing animals infected with AIV (H5N1 (HPAI) or H5N2 (LPAI)) with mock-infected animals. The colors within the venn diagram, as well as the colors of the GO-term boxes, stand for the respective condition: blue represents H5N1 infection 1 dpi, red represents H5N1 infection 3 dpi, green represents H5N2 infection 1 dpi, and yellow represents H5N2 infection 3 dpi for each species and tissue. Within the boxes, an arrow down indicates that the GO-term is enriched among the downregulated DEGs; otherwise, the terms are enriched among the upregulated DEGs. The GO-terms represent biological processes except, if stated differently, in the form of MF (molecular function). Venn diagrams are based on the data provided in Table S1.

