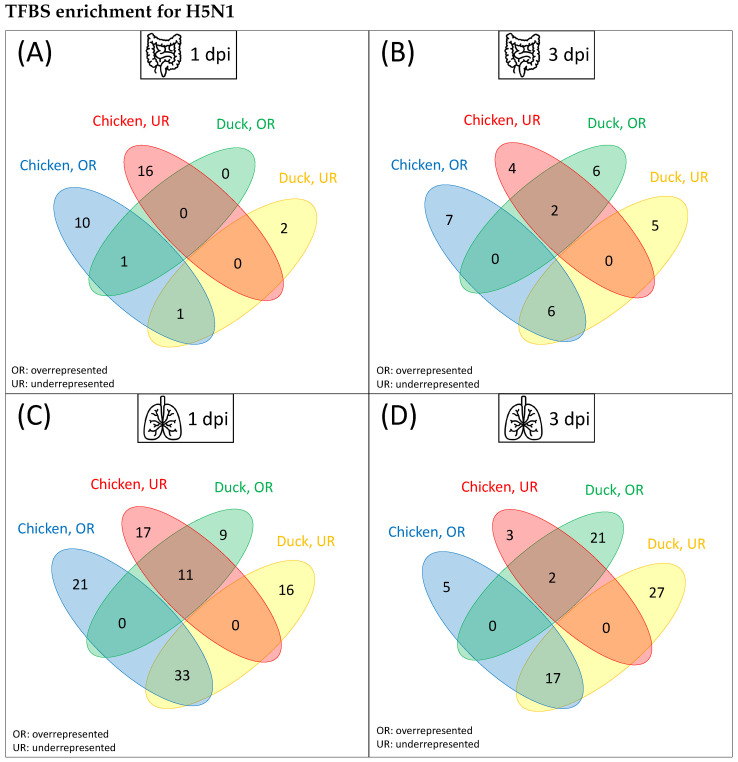
Figure 3.
Venn diagrams of TFBS enrichment to compare over- (OR) and underrepresented (UR) binding sites in chicken and duck. The promoter regions of DEGs (after infection with HPAIV H5N1) in duck and the corresponding orthologous genes in chicken were extracted to obtain the over- and underrepresented TFBSs. (A) shows the corresponding number of TFBSs for the ileum 1 dpi, (B) shows the ileum 3 dpi, (C) shows the lung 1 dpi and (D) shows the lung 3 dpi. Venn diagrams are based on the data provided in Table S3.

