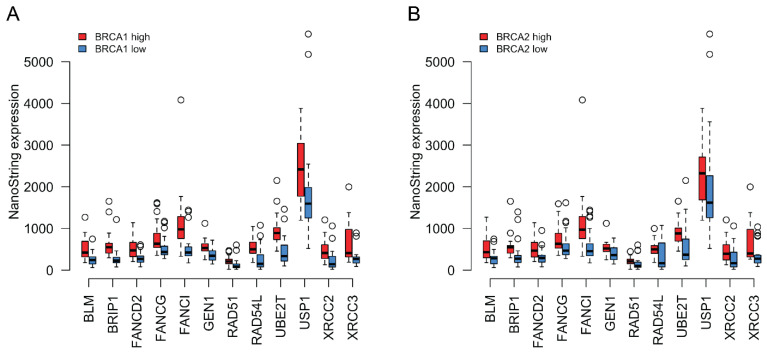
Figure 3.
(A) Coordinated expression of BRCA1 with other HR genes that were found upregulated in tumors compared to normal tissue. Red boxplots correspond to tumors where BRCA1 expression was equal to or above the median for all tumor samples, whereas blue boxplots represent samples where BRCA1 expression was below the tumor median. The thick horizontal lines show the median. Tumors with higher BRCA1 expression also tended to show higher expression of the other HR genes depicted. (B) Similar to (A) but classing the tumors based on BRCA2 expression instead.

