Figure 1.
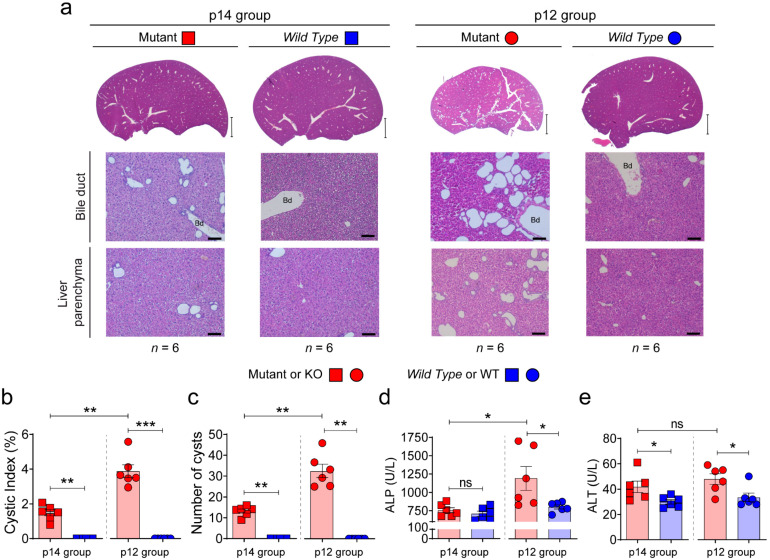
Characterization of the cystic liver phenotype at day 30 form p12 and p14 stages. Pkd1 deletion at p12 carries a more severe cystogenesis. (a) Representative macroscopic and microscopic images of hematoxylin–eosin stained from livers of Pkd1cond/cond;Tam-Cre mouse Wild Type (WT, Pkd1cond/cond;Tam-Cre−) and Mutant (KO, Pkd1cond/cond;Tam-Cre+) with Pkd1 gene deletion induced by tamoxifen at postnatal day 14 (p14 group) and 12 (p12 group). All mice were sacrificed at p30. Scale bar, 2 mm (upper panel) 100 µm (lower panel). n represents the number of samples per group, and Bd means bile duct. (b,c) Hepatic cystic index and number of cysts of the different phenotypes. (d,e) Blood serum ALP and ALT values. Bars represent means ± SEM in all cases. p < 0.05 by Student’s t-test (two-tail) was considered as a significant result. ns represents not significance. * p < 0.05, ** p < 0.01, *** p < 0.001.

