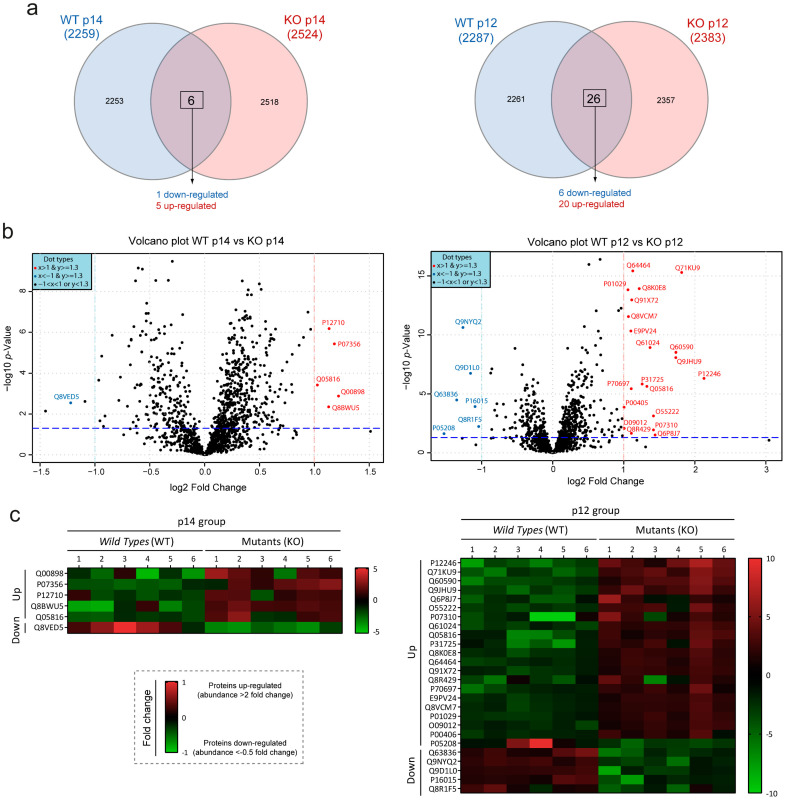
Figure 3.
Graphic representation of proteins with altered abundance in hepatic cystogenesis. (a) Quantitative Venn diagrams showing the proteins with significant alterations (up- and down-regulated) of p14 (left) and p12 (right) groups. See Table 1 for the complete list of proteins with significant differences. (b) Volcano plots comparing Wild Type and Mutant samples in p14 (left) and p12 (right) groups, respectively. Volcano plots showing proteins with significant differences of protein abundance (p-value < 0.05 and fold change > 2) up-regulated (red dots) or down-regulated (blue dots) in SWATH analysis. X-axis shows the fold change of log(2) (the red and green lines show the 2-fold cut-off up- and down-regulated, respectively) and Y-axis shows −log(10)-p-value (blue lines shows the cut-off point of a p-value < 0.05). (c) The heat maps represent the significant differences in protein abundance between individuals according to the areas of the SWATH spectral library. Red represents the up-regulated and green the down-regulated proteins.

