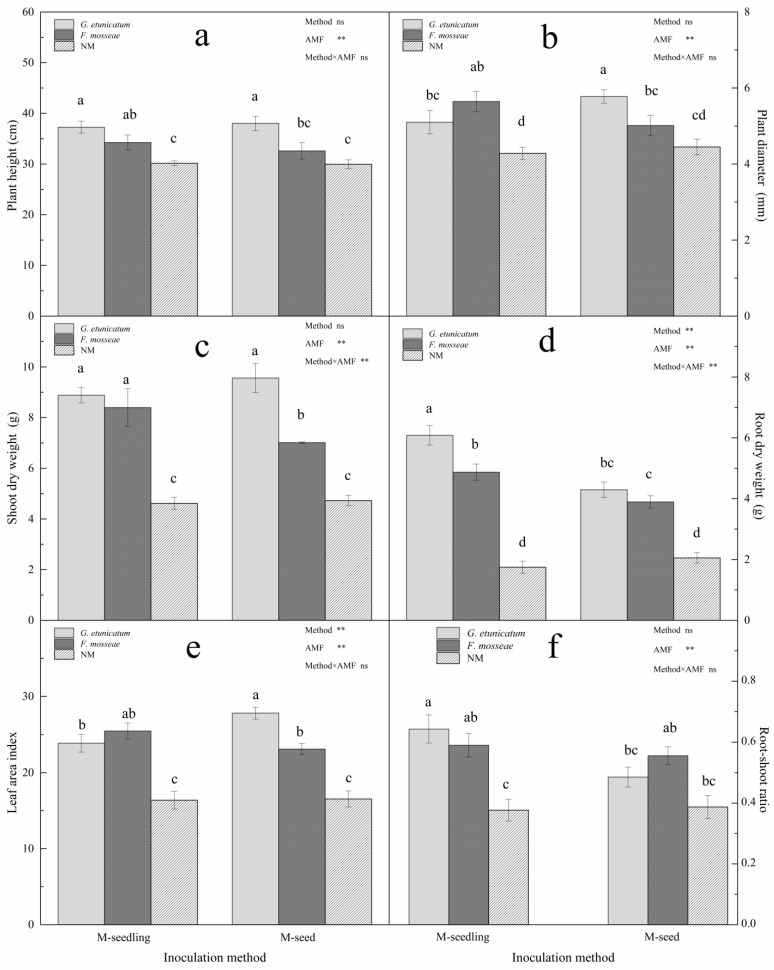
Figure 5.
Plant growth of C. migao seedlings under 6 different treatments. (a) Plant height of C. migao seedlings under 6 different treatments, (b) Plant diameter of C. migao seedlings under 6 different treatments, (c) Shoot dry weight of C. migao seedlings under 6 different treatments, (d) Root dry weight of C. migao seedlings under 6 different treatments, (e) Leaf area index of C. migao seedlings under 6 different treatments, (f) Root-shoot ratio of C. migao seedlings under 6 different treatments. Different letters (a, b, c, d) indicate a significant difference of Tukey’s post hoc test ( ** p < 0.01; ns, not significant) between all treatments. NM, non-AMF plants; G. etunicatum, plants inoculated with G. etunicatum; F. mosseae, plants inoculated with F. mosseae; M-seedling, inoculated by the seedling method; M-seed, inoculated by the seed method. Values are expressed as the mean ± SE (n = 6, which are treatment replicates).

