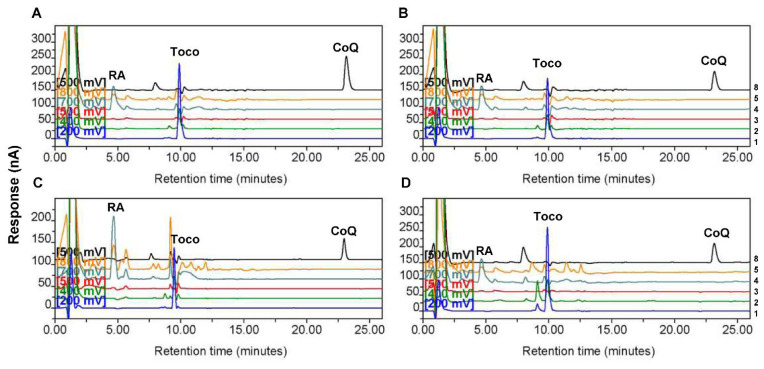
Figure 1.
Representative high-performance liquid chromatography chromatograms showing the peaks of retinyl acetate (RA), α-tocopherol, and coenzyme Q10 (CoQ10) in control and astrocytoma tissues. Chromatograms for one tissue sample from (A) non-tumor control, (B) low-grade astrocytoma, (C) Grade III astrocytoma, and (D) Grade IV astrocytoma groups. The numbers at the right side indicate the channel numbers. The chromatograms for Channels 1 (200 mV), 2 (400 mV), 3 (500 mV), 4 (700 mV), 5 (800 mV), and 8 (500 mV) are indicated by the color of blue, light green, red, dark green, yellow, and black, respectively. The chromatograms for Channels 6 and 7 (−1000 mV) are not shown. RA indicates the dominant peak of RA, the internal standard, on Channel 4 (700 mV). Toco and CoQ indicate the dominant peaks of α-tocopherol and CoQ10 on Channel 1 (200 mV) and Channel 8 (500 mV), respectively.

