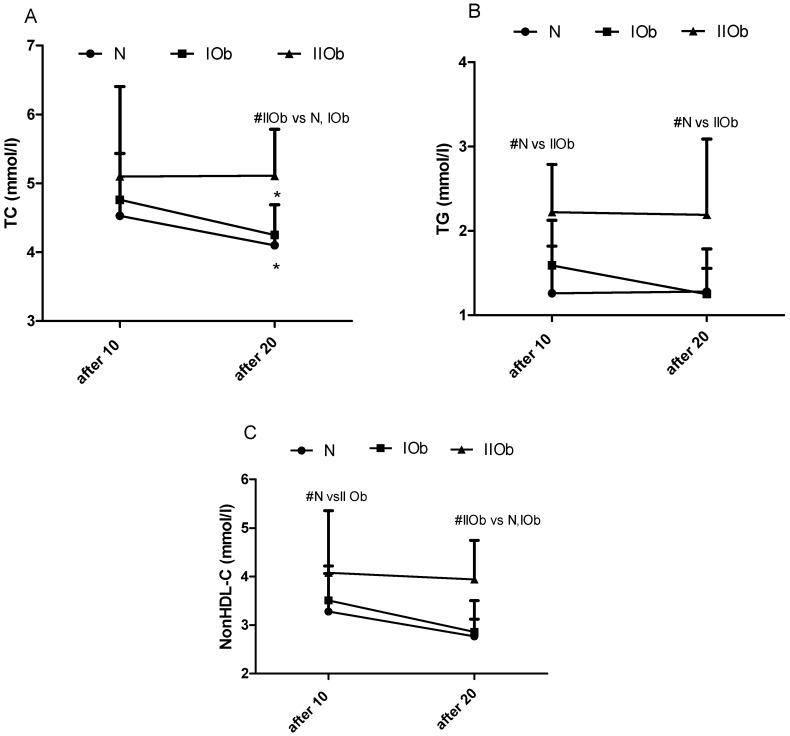
Figure 3.
Changes in total cholesterol (TC) (A), triglycerides (TG) (B), and non-HDL-C (C) levels between the three groups after 10 and 20 WBC sessions. Normal ranges: TC, 3.0–5.0 mmol/L; TG, no more than 1.70 mmol/L; non-HDL-C, 3.8 mmol/L for low cardiovascular risk (<1% SCORE scale), <3.4 mmol/L for moderate cardiovascular risk (≥1% to <5% SCORE scale), <2.6 mmol/L for high cardiovascular risk (≥5% to <10% SCORE scale), and <2.2 mmol/L for very high cardiovascular risk (≥10% SCORE scale); *—significant differences in values between sessions within groups (p < 0.05); #—significant differences in values between groups in the same timepoints (p < 0.05). Two-way ANOVA revealed significant differences between the three groups for interaction, row factor, and time.

