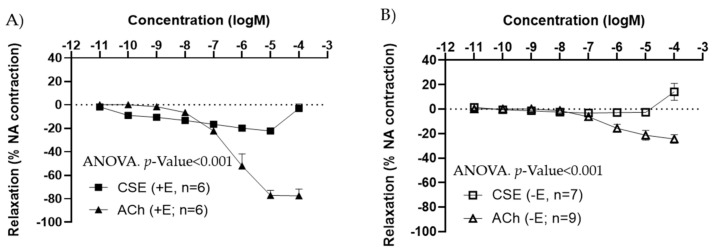
Figure 2.
Concentration–response curves to ACh and CSE in precontracted iliac arteries from male adult rats with endothelium (+E, black symbols) (A), and without endothelium (−E, white symbols) (B). Relaxation is expressed as a percentage of maximal contraction to NA (10−7 M). Data represent the mean ± SEM; n indicates the number of segments from 3 different rats per group. Statistical analysis was performed by 2-way ANOVA considering concentration and drugs (ACh or CSE) as factors. The p-value was extracted of the interaction term of the ANOVA. ACh, Acetylcholine; CSE, cocoa shell extract.

