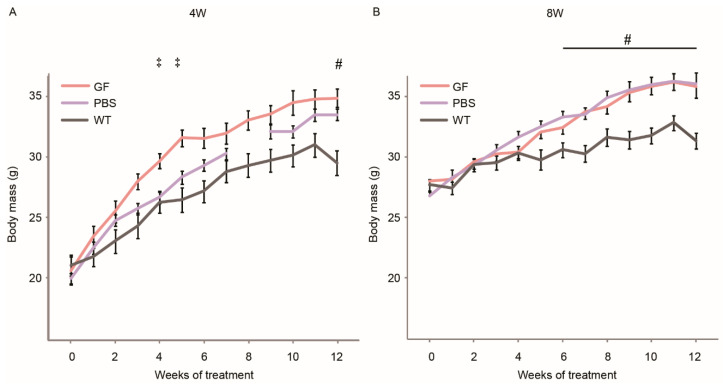
Figure 1.
Growth curves of the different treatment cohorts. The growth pattern of the six groups in the 4W cohort (A) and the 8W cohort (B). Lack of data point in 4W PBS is due to accidental loss of measurements. GF, growth factor; PBS, phosphate-buffered saline; WT, wild-type strain. Vertical bars are SEM. Two-way ANOVAs were performed with subsequent Tukey HSD post-hoc tests to assess significance. Symbols indicate p < 0.05: ‡; GF vs. PBS, #; PBS vs. WT. The number N of each group was 12.

