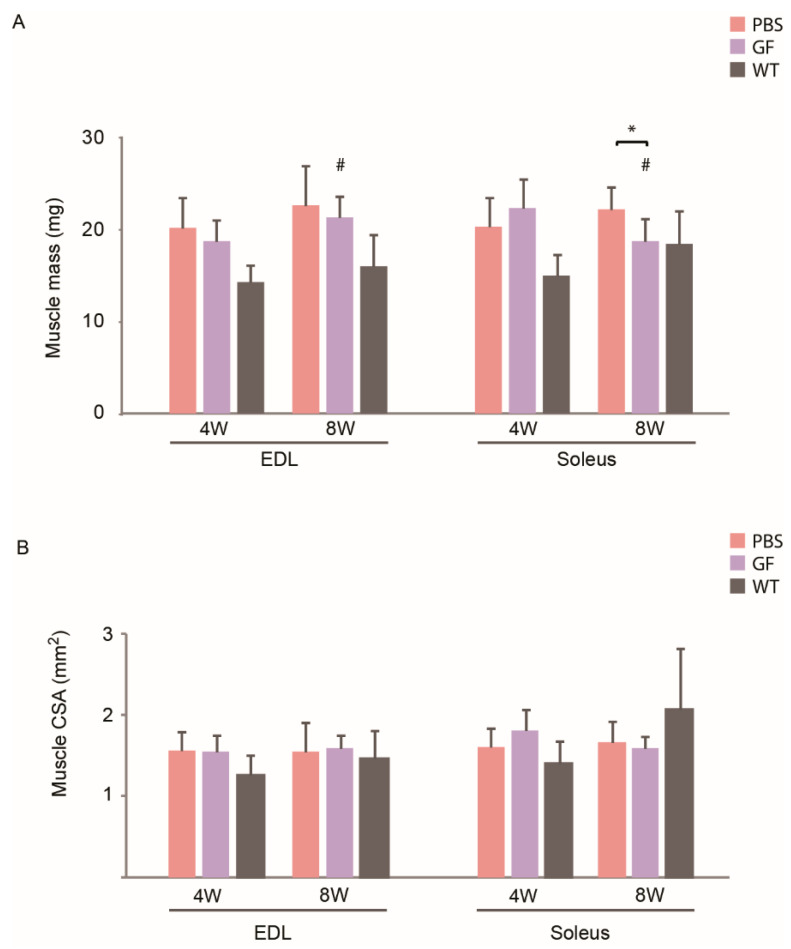
Figure 2.
Muscle mass (A) and CSA (B) of hind-limb muscles of young (4W) and adolescent (8W) mdx mice treated for 12 weeks with growth factors. N for 4W animals: PBS, 12; GF, 11; WT, 11. N for 8W animals: PBS, 12; GF, 9; WT, 12. CSA, cross-sectional area; EDL, m. extensor digitorum longus; GF, growth factor; PBS, phosphate-buffered saline; WT, wild-type strain. Data presented as mean and vertical bars representing SD. Two-way ANOVAs were performed with subsequent Tukey HSD post-hoc tests to assess significance. Horizontal bars indicate significance: * p < 0.05, # p < 0.05 vs. 4W animals.

