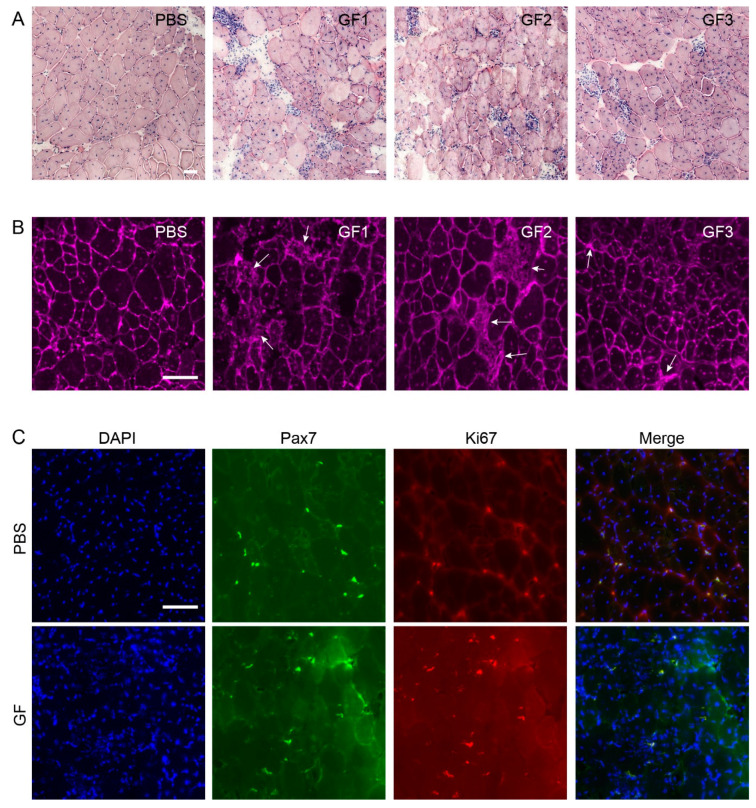
Figure 7.
Effect of treatment on histopathology. H&E, WGA, and IHC stains of treated (GF) versus controls (PBS) mdx animals. (A) H&E stains demonstrate fiber size variation, focal inflammation, and necrotic fibers in treated animals compared to controls. (B) WGA showed increased fibrosis (arrows) in treated animals. (C) DAPI (blue), Pax7 (green), and Ki67 (red) showed activation of satellite cells. Bars represent 50 mm.

