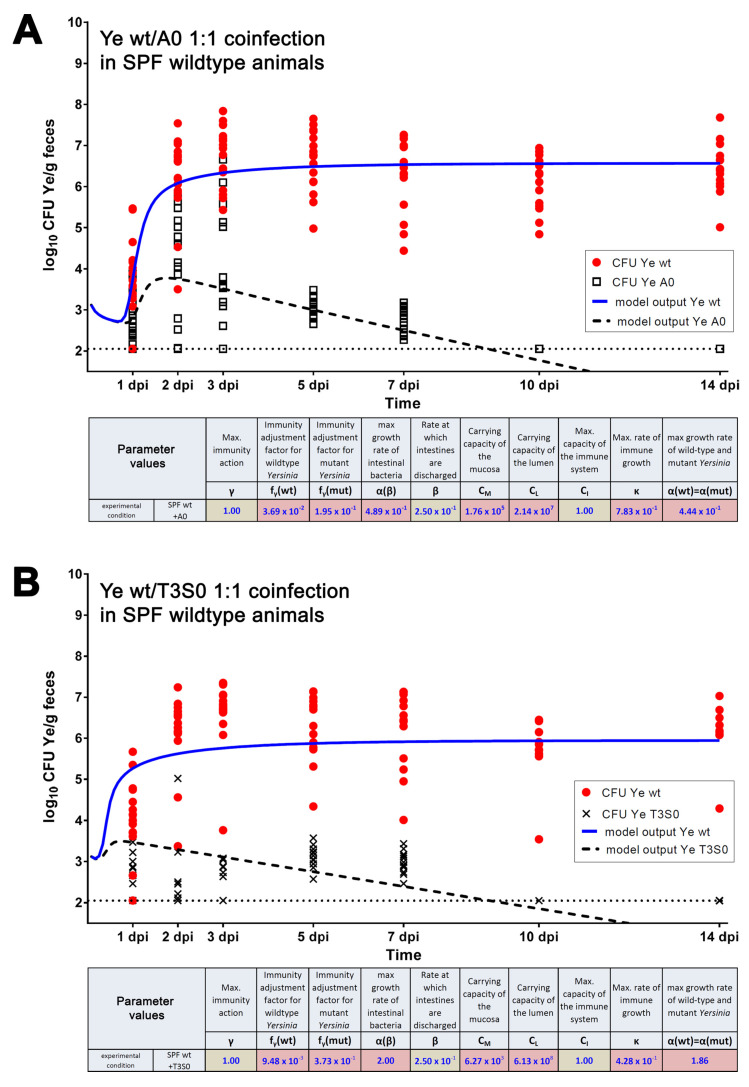
Figure 4.
Overlay of model output and experimentally determined CFU values during Ye coinfection of SPF wild-type mice. When fitting the model to our experimental data, we obtained the parameter values listed in the inset tables. (A) Model output for CFU of Ye wt and Ye YadA0 shown as an overlay with experimental data. CFU values of individual animals at indicated points of time are shown for Ye wt and Ye YadA0. The dotted line indicates the limit of detection of our experimental system. (B) Model output for CFU of Ye wt and Ye T3S0 as an overlay with experimentally determined CFU values from the Ye wt:Ye T3S0 coinfection of SPF wild-type mice. The tables indicate fixed and calculated parameter values with green or red backgrounds, respectively; dpi = days post-infection.

