Figure 2.
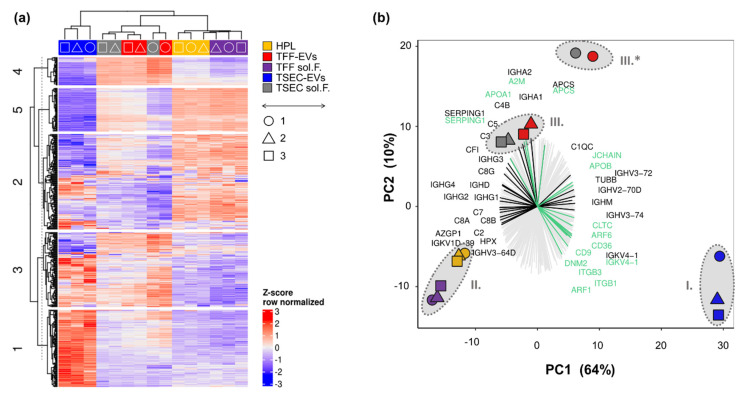
Proteomic profiling of HPL-derived samples. (a) Tandem mass-tag (TMT) proteomics of HPL, TFF-EVs, TFF sol.F., TSEC-EVs and TSEC-soluble fractions were analyzed by unbiased clustering in a heatmap indicating five main clusters (1–5, left side). Protein detection levels were row-wise Z-score normalized. Color code as indicated with most replicates grouping together (top) with symbols indicating the three independent experiments (◯△☐). (b) Bi-plot including a principal component (PC) analysis and a protein recovery loading plot. Three major clusters composed of (I.) TSEC-EVs (blue symbols), (II.) HPL + TFF sol.F. (yellow and violet symbols) and (III.) TFF-EVs + TSEC-soluble fractions (red and grey symbols, respectively). (III*) Biological replicate 1 differed more in relation to other samples, but was still included within cluster III. Three biological replicates, each performed in three technical replicate runs. A loading plot is also showing the contribution of the 477 detected proteins towards the different clusters. Lines pointing towards a cluster show an enrichment of proteins in this specific cluster. We highlighted in black the “lymphocyte mediated immunity” related proteins and in green the “receptor-mediated endocytosis” proteins.

