Figure 3.
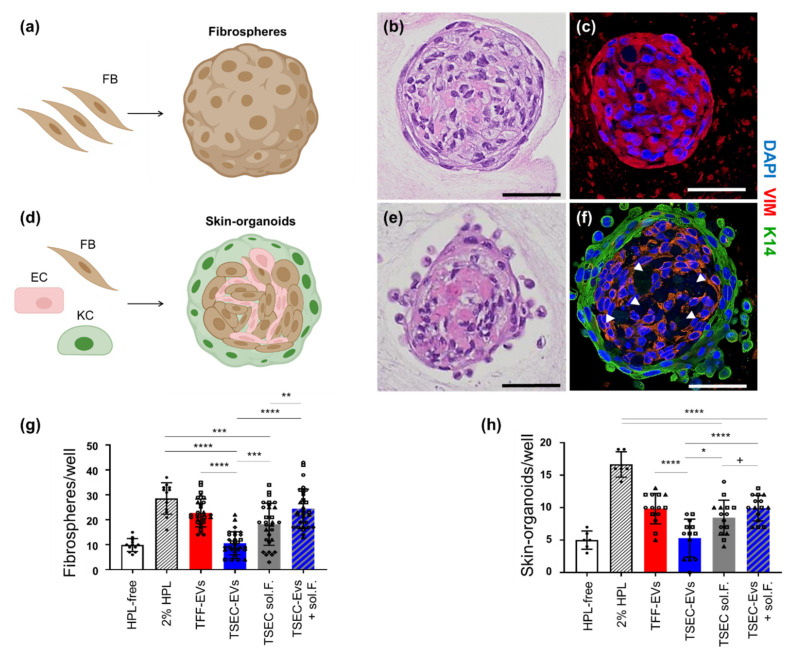
TSEC-EVs enhance fibrosphere and skin-organoid formation in the presence of platelet proteins. (a–c) Fibrosphere formation. (a) Cartoon illustrating monotypic fibroblast (FB) aggregation. (b) Hematoxylin eosin staining and, (c) immunostaining of representative fibrospheres showing compact and human vimentin (VIM)-positive structures. (d–f) Skin-organoid formation. (d) Cartoon illustrating aggregation of primary human FBs, keratinocytes (KCs) and endothelial cells (ECs) when seeded in a 2:1:1 ratio in a permissive environment. (e) Hematoxylin and eosin staining of a representative skin organoid presenting a compact core with stratified envelope. (f) Immunohistochemistry confirmed a human VIM-positive dermal core with vascular-like empty spaces (white arrow heads) and a surrounding cytokeratin K14-positive KC layer. Scale bars: 50 µm. Schematic cartoons created using Biorender. (g) Quantification of fibrospheres per well was performed after incubation of 105 EVs/cell. Matching protein concentrations of TSEC-soluble fractions 19–21 and TSEC-EVs plus their corresponding TSEC-soluble fractions (TSEC-EVs + soluble fractions) after 6 days with 5000 FBs per well (n = 5). (h) 2500 KCs, 1250 FBs and 1250 ECs per well for skin-organoid quantification were analyzed accordingly (n = 3). Each symbol (circles, squares and triangles) represents a different biological replicate (n = 5 for fibrosphere assay, n = 3 for skin-organoid assay), each performed in hexaplicates. One-way ANOVA/Tukey, **** p ≤ 0.0001, *** p ≤ 0.001, ** p ≤ 0.01, * p ≤ 0.05; + p ≤ 0.05; one-tailed t-test.

