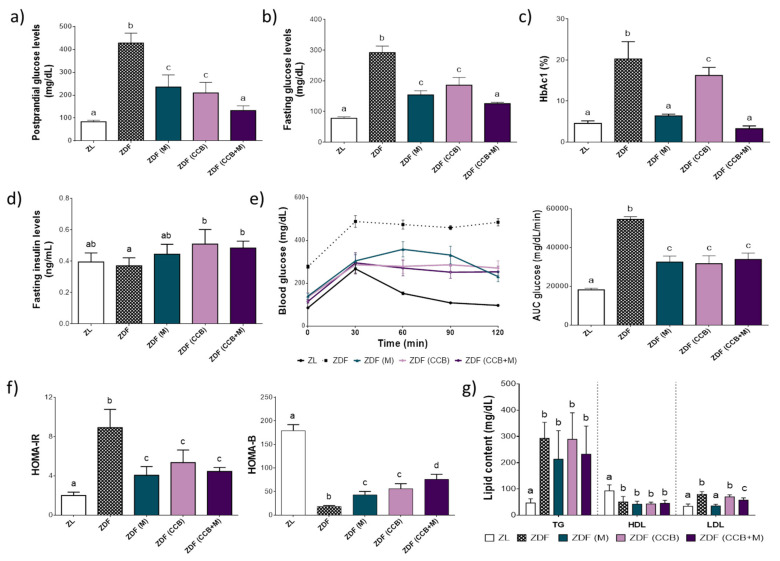
Figure 1.
Effect of CCB, metformin and their combination on glucose and lipid homeostasis. (a) Postprandial glucose levels. (b) Fasting glucose levels. (c) Glycosylated haemoglobin (HbA1c). (d) Serum insulin levels. (e) Blood glucose levels during GTT and area under the curve (AUC) calculated from the GTT data. (f) Homeostasis model assessment (HOMA)-IR and HOMA-B. (g) Levels of TG, HDL, and LDL in serum. Data represent the means ± SD of 6–8 animals per condition. Means without a common letter differ, p < 0.05. Zucker lean (ZL), Zucker Diabetic rats (ZDF), Zucker Diabetic rats treated with metformin (ZDF (M)), Zucker Diabetic rats fed with a CCB rich-diet (ZDF (CCB)), and Zucker Diabetic rats treated with metformin and fed with a CCB rich-diet (ZDF (CCB + M)).

