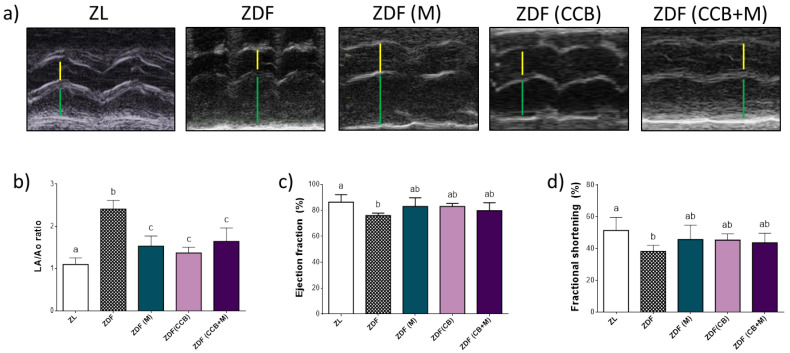
Figure 2.
Effect of CCB, metformin and their combination on cardiac function. (a) Representative images of M-mode echocardiogram for each group with the measurement points of aorta diameters (yellow lines) and left atrium diameter (green lines). (b) LA/Ao ratio. (c) LV ejection fraction (EF). (d) LV fractional shortening (FS). Means ± SD of 6–8 samples per condition. Means without a common letter differ significantly. Zucker lean (ZL), Zucker Diabetic rats (ZDF), Zucker Diabetic rats treated with metformin (ZDF (M)), Zucker Diabetic rats fed with a CCB rich-diet (ZDF (CCB)), and Zucker Diabetic rats treated with metformin and fed with a CCB rich-diet (ZDF (CCB + M)).

