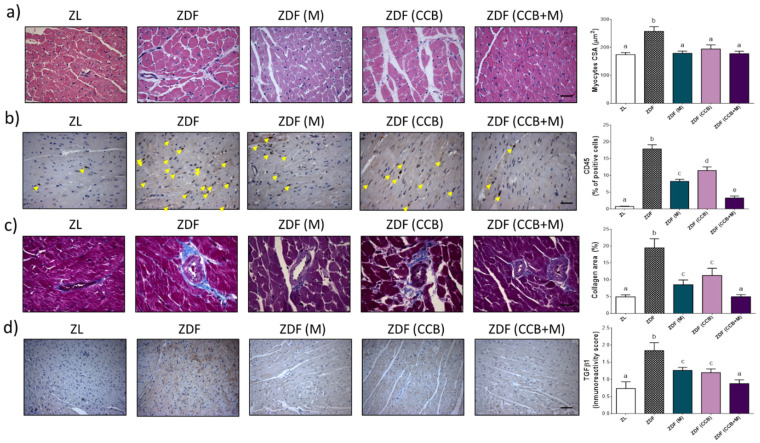
Figure 3.
Effect of CCB, metformin and their combination on cardiac remodelling. (a) Representative sections of left ventricles stained with H and E (scale bars: 10μm) and quantitative data for myocyte cross sectional area. (b) Representative photographs of immunohistochemical staining of CD45 (brown-stained) (scale bar 10 μm). CD45 is expressed as a percentage of positive cells relative to total cells. (c) Representative images of collagen fibres in interstitial and perivascular areas shown by Masson’s trichrome staining (blue-stained) (scale bars: 10μm) and quantification of collagen areas (%). (d) Representative photographs of immunohistochemical staining of TFG-β1 (brown-stained) (scale bar 20 μm) and immunoreactive score. Values are expressed as means ± SD of 6–8 animals per condition. Means without a common letter differ, p < 0.05. Zucker lean (ZL), Zucker Diabetic rats (ZDF), Zucker Diabetic rats treated with metformin (ZDF (M)), Zucker Diabetic rats fed with a CCB rich-diet (ZDF (CCB)), and Zucker Diabetic rats treated with metformin and fed with a CCB rich-diet (ZDF (CCB + M)).

