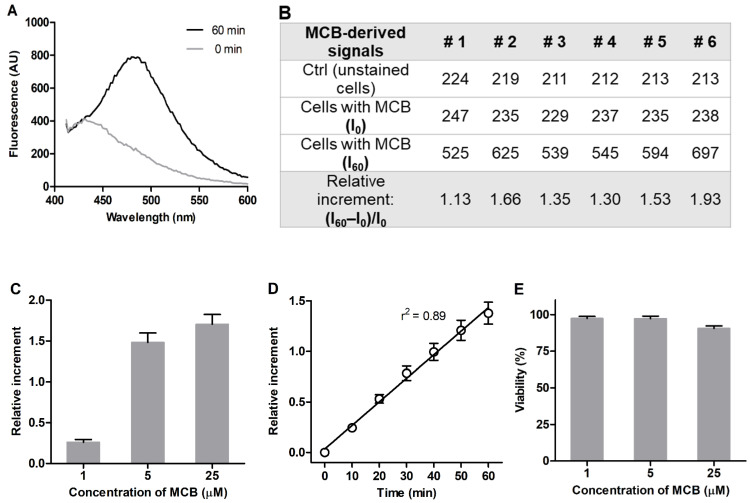
Figure 1.
Optimization of MCB detection in 3T3 fibroblasts grown in 96-well plates. (A) Fluorescence emission spectra of 5 μM MCB in adhered 3T3 fibroblasts in HBSS (λex = 380 nm, ‘bottom’ mode). (B) Representative fluorescence values for MCB-stained cells (AU) collected from six wells. (C) Concentration dependence of MCB signal (60 min incubation). (D) Time dependence of MCB signal (5 μM MCB). (E) Viability of MCB-treated cells according to MTT assay (relative to viability of untreated cells = 100%). Mean values ± SEM (n = 6) are shown.

