Figure 6.
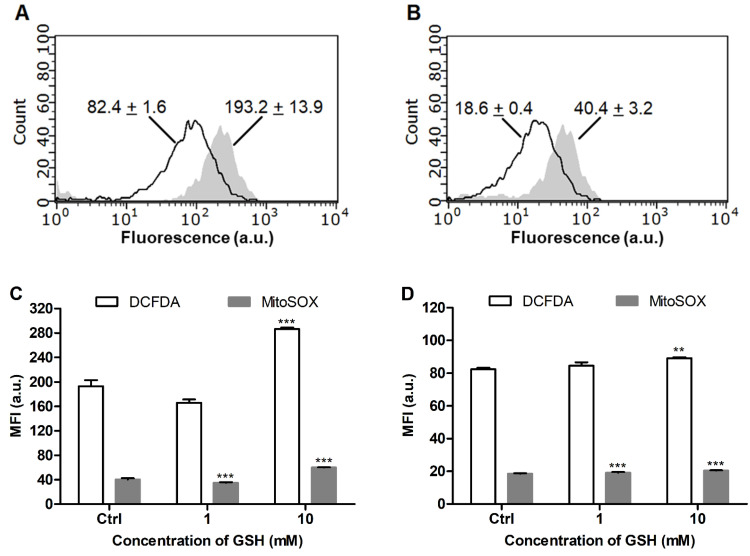
Distribution of (A) DCFDA and (B) MitoSOX fluorescence in intact LN-229 (filled curve) and SNB-19 (unfilled curve) cells according to flow cytometry (mean channel fluorescence for each curve is indicated). Mean signals of the probes after 1 h treatment of (C) LN-229 and (D) SNB-19 cells with GSH. Mean ± SEM (n = 3, ** p < 0.01, *** p < 0.001 vs. Ctrl) are shown.

