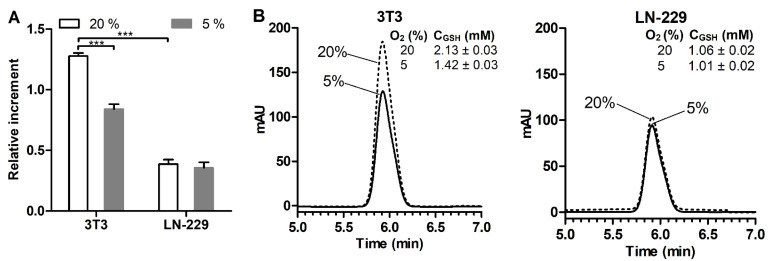
Figure 7.
(A) MCB signals in intact 3T3 fibroblasts and LN-229 glioblastoma cells cultured under 20% and 5% oxygen levels for 5 h. (B) Corresponding reverse-phase HPLC chromatogramms of GSH in cell lysates (1 × 10⁶ cells per 1 mL) and found GSH concentrations. Mean ± SEM (n = 6, *** p < 0.001) are shown.

