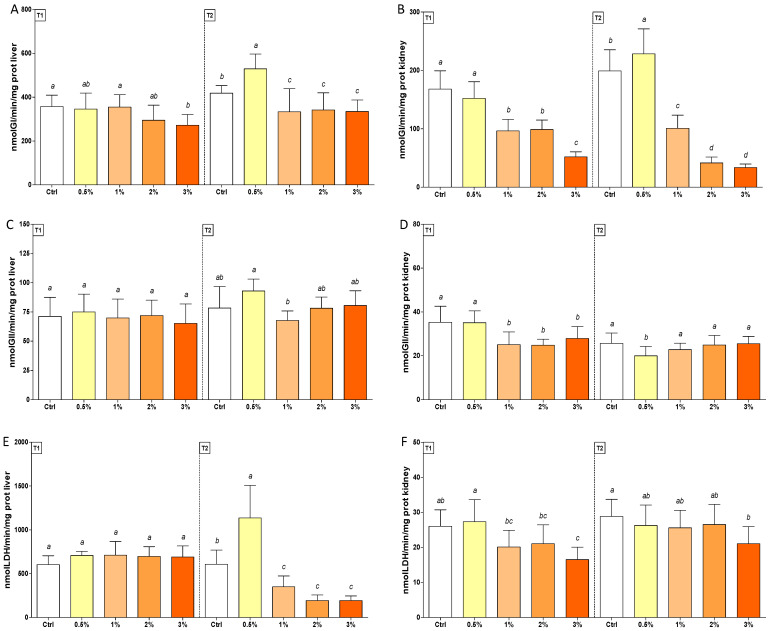
Figure 4.
Enzymatic activity of GI (Panel (A,B)), GII (Panel (C,D)), and LDH (Panel (E,F)) in livers (on the left, Panel (A,C,E)) and kidneys (on the right, Panel (B,D,F)) of rainbow trout Oncorhynchus mykiss fed with F1-BEO-supplemented diets (0.5%, 1%, 2%, 3% (w/w) supplementation) after 15 (T1) and 30 (T2) days. Different lowercase letters indicate statistically significant differences among experimental groups (p < 0.05) for each experimental endpoint.

