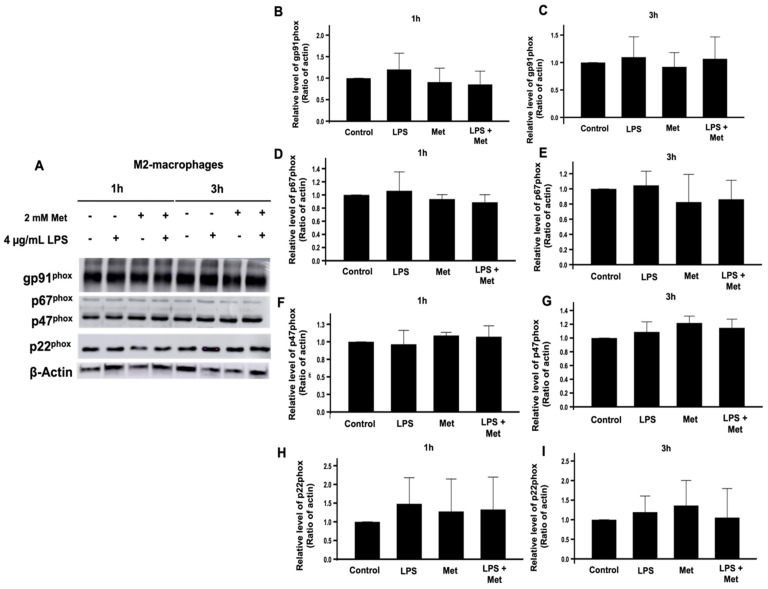
Figure 4.
Effect of metformin on the expression of the NADPH oxidase components. M2 macrophages were incubated in the absence or the presence of 2 mM metformin then stimulated by LPS (4 µg/mL) for 1 and 3 h. The expression of gp91phox, p22phox, p47phox, and p67phox was evaluated compared to actin by SDS-PAGE and Western blot using specific antibodies (A). The gp91phox (B,C), p67phox (D,E), p47phox (F,G), p22phox (H,I) and actin bands from three experiments were quantified and expressed as mean ± SD.

