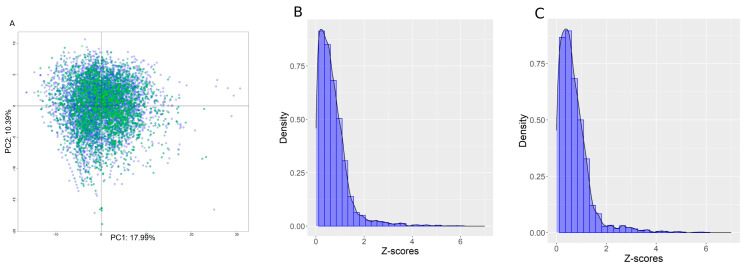
Figure 2.
(A) PCA plot in the two first dimensions computed using the filtered set of descriptors on the training set. Blue represents chemicals in the training set, and green is the internal test set. PCA covered, in the first two dimensions, 28.3% of the descriptor variability. (B,C) Z-score distributions for the training and internal test sets, respectively.

