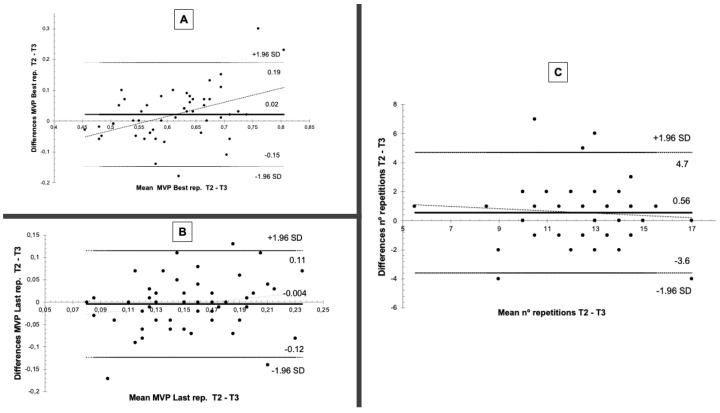
Figure 2.
Bland–Altman plots of intra-individual variability (test (T2)-retest (T3)) pertaining to (A) mean propulsive velocity attained during the best repetition (MPV Best); (B) mean propulsive velocity attained during the last repetition (MPV Last); and (C) number of repetitions performed at 70% intensity (MNR).

