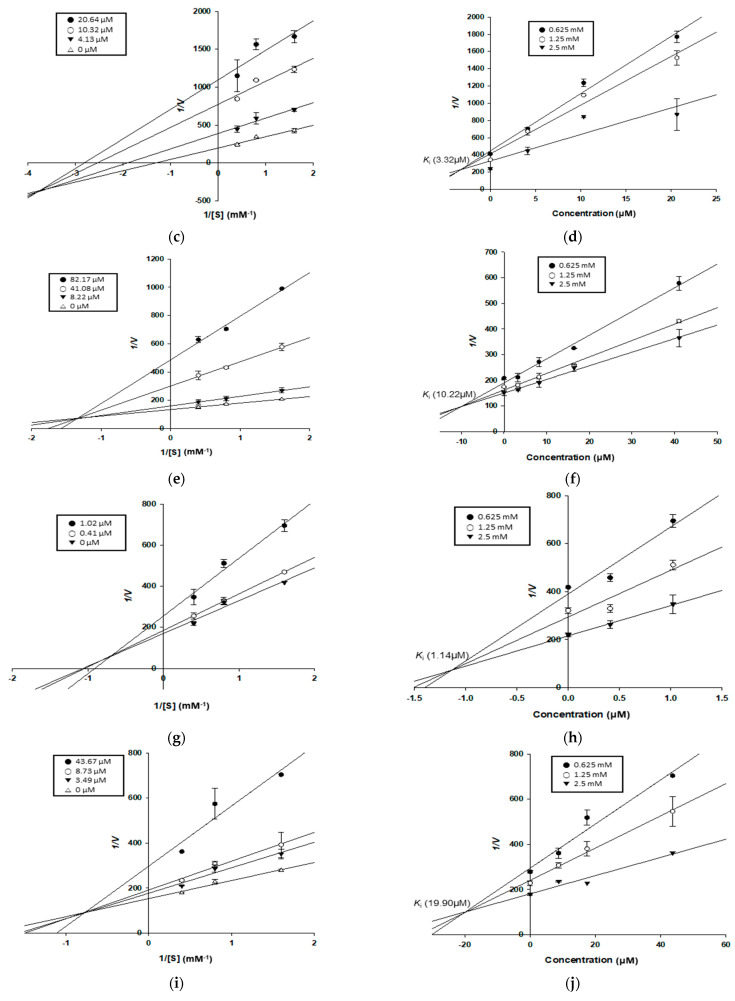
Figure 2.
Lineweaver–Burk plots (a,c,e,g,i,k) and Dixon plots (b,d,f,h,j,l) of α-glucosidase inhibition by compounds 1–3 and 5–7, respectively: (a,b) for kuwanon C (1); (c,d) for moracin M (2); (e,f) for dihydromorin (3); (g,h) for oxyresveratrol (5); (i,j) for norartocarpetin (6); (k,l) for kuwanon G (7).


