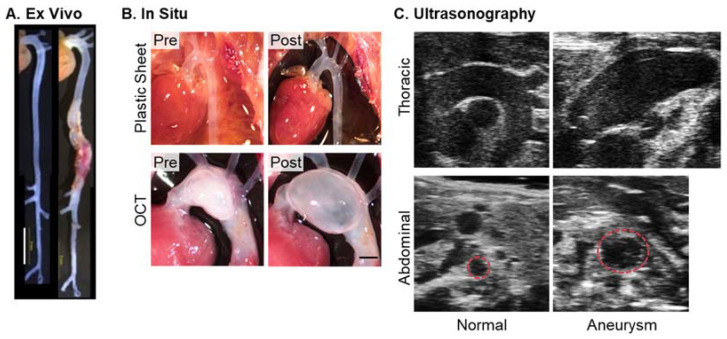
Figure 2.
Examples of aortic images in mice. Representative images of (A) ex vivo [95] and (B) in situ approaches (authors’ unpublished data and the work of [105]), and (C) ultrasonography [14]. Ultrasound images were captured by Vevo 2100 with an MS550D (40 MHz). For in situ imaging, a piece of black plastic sheet was placed behind the aorta to enhance the contrast of the aortic wall. Subsequently, O.C.T. (optimal cutting temperature, 100–150 µL) compound was injected from the left ventricle using an insulin syringe (31G). Scale bars in Figure (A) and (B) indicate 5 and 1 mm, respectively.

