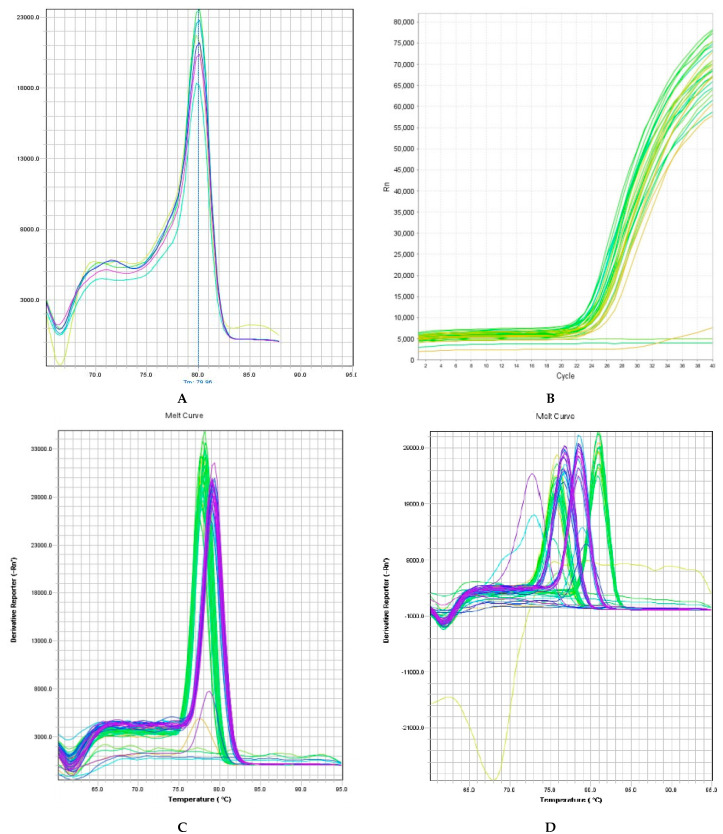
Figure 9.
Melting curves observed for qPCR analysis of the relative expression of PAL, POD, SOD, WRKYa, PAL1, DEF-1, CAT-2, WRKY40, HSFC1, LOX2, and NPR1 genes normalized to UBI3 after different treatments: mock, RS (R. solanacearum), KA9 + RS (Bacillus subtilis + R. solanacearum), PDS1 + RS (Pseudomonas fluorescens + R. solanacearum), KA9 + PDS1 + RS (Bacillus subtilis + Pseudomonas fluoresecens + R. solanacearum), and BABA (chemical control). Melting curve (A) and amplification plot (B) observed for qPCR analysis of relative expression of normalized Ubi3 gene in chili. (C) Genes yielding a single melting curve. (D) Genes shown multiple peaks (marked by red arrows) were excluded from the analysis.

